Search
Inside the Frequency Domain Identification editors it is possible to use the Automatic Modal Estimation feature. This feature allows the user to automatically estimate the modal parameters of the system just with a simple click. The result will be an estimation of all well-separated modes.

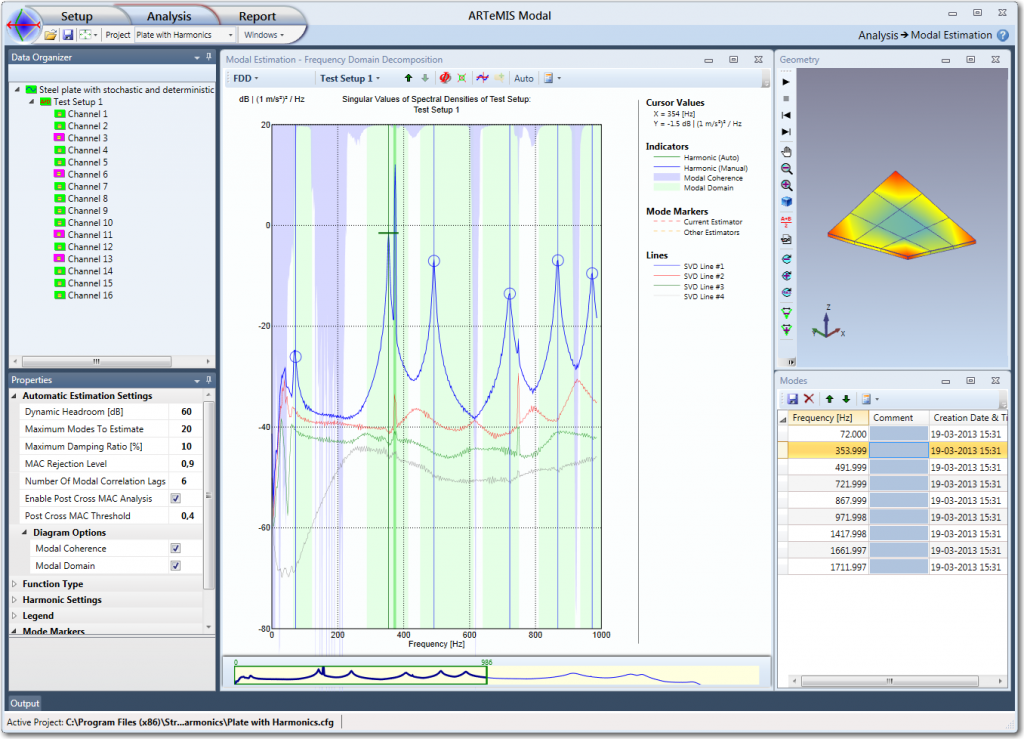
In addition to presenting the modes found automatically, there is also the so-called modal domain shown of each mode (represented with a light green color in the back of the diagram), and the harmonic indicator (represented as vertical lines with a strong green color), and finally the modal coherence (shown in light blue colors).
There are a number of settings that can be modified for the automatic modal estimation. Normally the default settings works in most case but it might be necessary to adjust them in difficult cases. Below the different setting are explained. The are all available in the Properties window in the section called Automatic Estimation Settings.
You can specify the Maximum Modes to Estimate that should be picked. When this number is reached then the search will stop.
The Maximum Damping Ratio is the maximum damping a potential mode should have. When a mode is picked out its damping ratio is estimated using the simple half power band-width estimate. If this damping estimate is larger than the specified value then the peak is excluded.
In order not to keep on searching for very weak modes the maximum difference in spectral energy in dB can be specified. Here this value is called Dynamic Headroom. When the difference between the highest peak in the spectrum and the currently tested peak becomes larger than this value, then the search stops.
Finally, it is possible to specify which Test Setup to use the Singular Values from in the search for peaks. The algorithm will use the average Singular Values of all Test Setups if the Measurement Project Item (All Test Setups level) is selected. Otherwise the search is based on the singular values diagram of the selected Test Setup.
Modal Domain Identification
The automatic search for peaks relies on the estimation of the so-called Modal Coherence. The modal coherence at a certain frequency is calculated by taking the first singular vector at the position and calculating the averaged dot products with the first singular vectors of the closest neighboring frequencies. In the No. Modal Correlation Lags field it can be specified how many neighboring frequencies to average from. Here, six are
selected meaning that the six closest first singular vectors on both sides of the current frequency are used. The larger number specified, the more smooth the modal coherence will become.
The modal coherence is a measure that will be 1 in the region where a specific mode is dominating, which is around the resonance peaks. In between peaks the modes are mixed and the modal coherence will drop significantly. In the Modal Estimation window the modal coherence is shown with blue colors (default) as shown above. The top of the Peak Picking window indicates a modal coherence of 1 and the bottom is 0. The modal coherence is seen to frame the individual peaks, and this is what the search algorithm is making use of. It will only find the largest peak inside the frequency area where the modal coherence is larger than the value specified by Minimum Modal Coherence.
NOTE: If the largest peak in such a frequency range is a harmonic, then it will be picked out as a peak of a modes unless there is a harmonic indicator telling the algorithm, that this peak is a harmonic. Therefore, remember to detect the harmonics if there are deterministic signals in the data that originates from rotating machinery.
Mode Shape Correlation Analysis
When a set of peaks has been picked out automatically, there is no guarantee that it is just modes that these peaks are originating from. As a post processing step it can be beneficial to perform a mode shape correlation analysis. If the mode shapes have many coordinates covering all directions of the structure tested, then they are likely to be close to orthogonal to one another. Thus by calculating the Modal
Assurance Criterion (MAC) between the estimated shapes, it is possible to exclude the ones that correlate too much with the others. A shape of a harmonic will e.g. look very much like the closest mode shape, and the MAC value between the two shapes will be very high. Therefore a too high MAC value between one shape and the rest can be used to assess if it is a mode shape or not. If not, then the estimate should be discarded. The analysis is activated by checking the Enable Cross MAC Analysis check box, and the maximum allowed MAC value is specified in the Post Cross MAC Threshold field. A lower value specifies that the estimated shapes have to be more orthogonal on one another.
For a theoretical explanation of the all these terms please have a look at the following article:
P. Andersen, R. Brincker, M. Goursat, L. Mevel:
Automated Modal Parameter Estimation For Operational Modal Analysis of Large Systems
Proceedings of the 2nd International Operational Modal Analysis Conference (IOMAC), Copenhagen, Denmark, 2007.