Search

The information described in this case study is by courtesy of the European research projects “Integrated European Industrial Risk Reduction System (IRIS)” and “Internet based Structural Monitoring System (ISMS)”. Special thanks to H. Wenzel, Vienna Consulting Engineers ZT GmbH (VCE), M. Döhler and L. Mevel (Inria) and C.E. Ventura (The University of British Columbia).
In the case study the tools of the ARTeMIS-SHM solution have been used. These are:
ARTeMIS Modal Pro
Modal Parameter History Plugin
Damage Detection Plugin
Automatic File Upload Plugin
SHM Automation Service
www.artemis-shm.com web portal
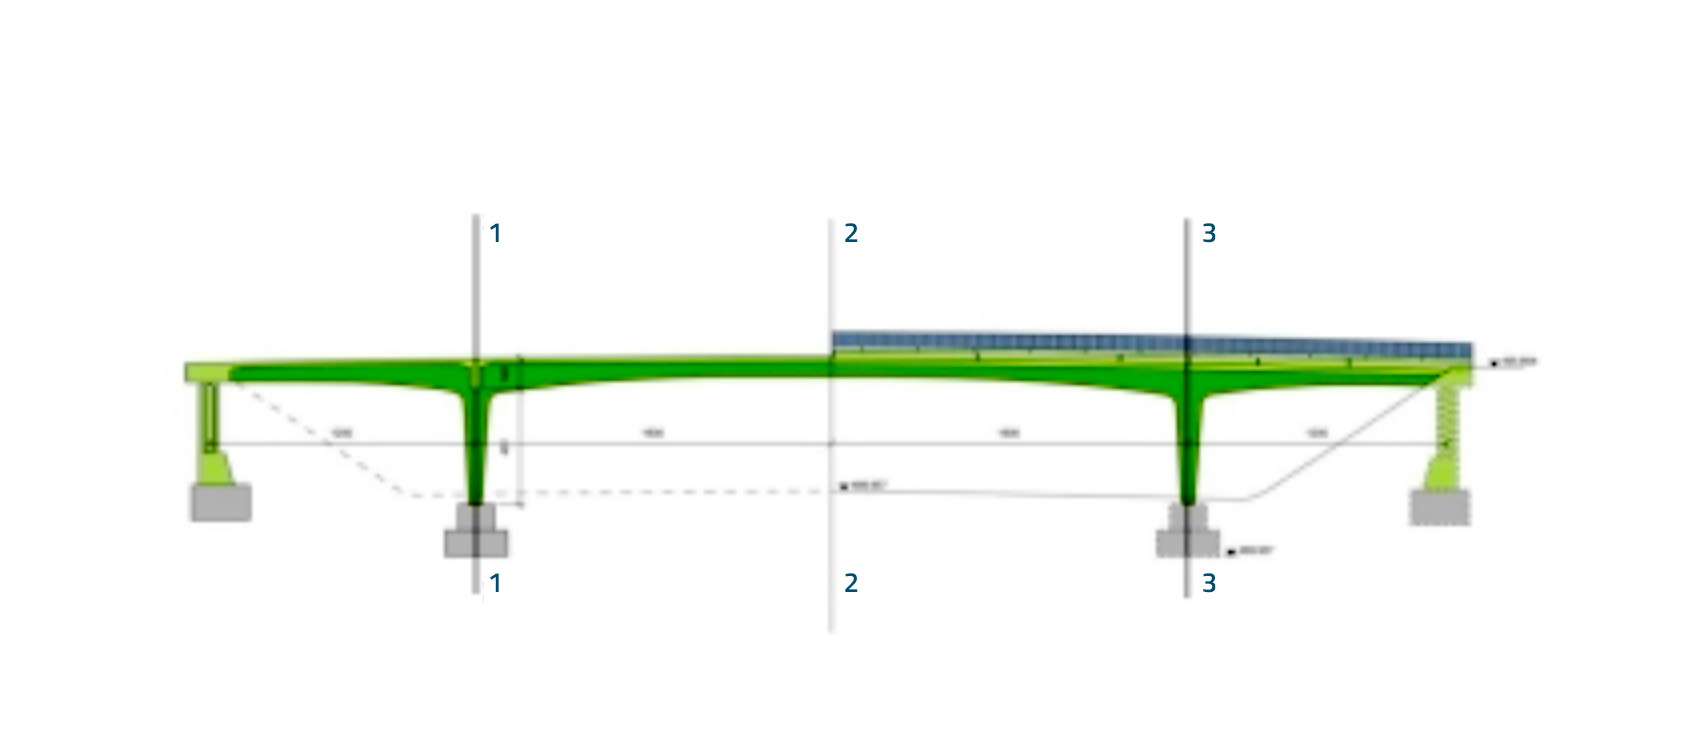
The S101 highway bridge was a prestressed concrete bridge located in Reibersdorf, Austria. With the main span of 32m, side spans of 12 m, and a width of 6.6 m, it crossed the national highway A1 Westautobahn.
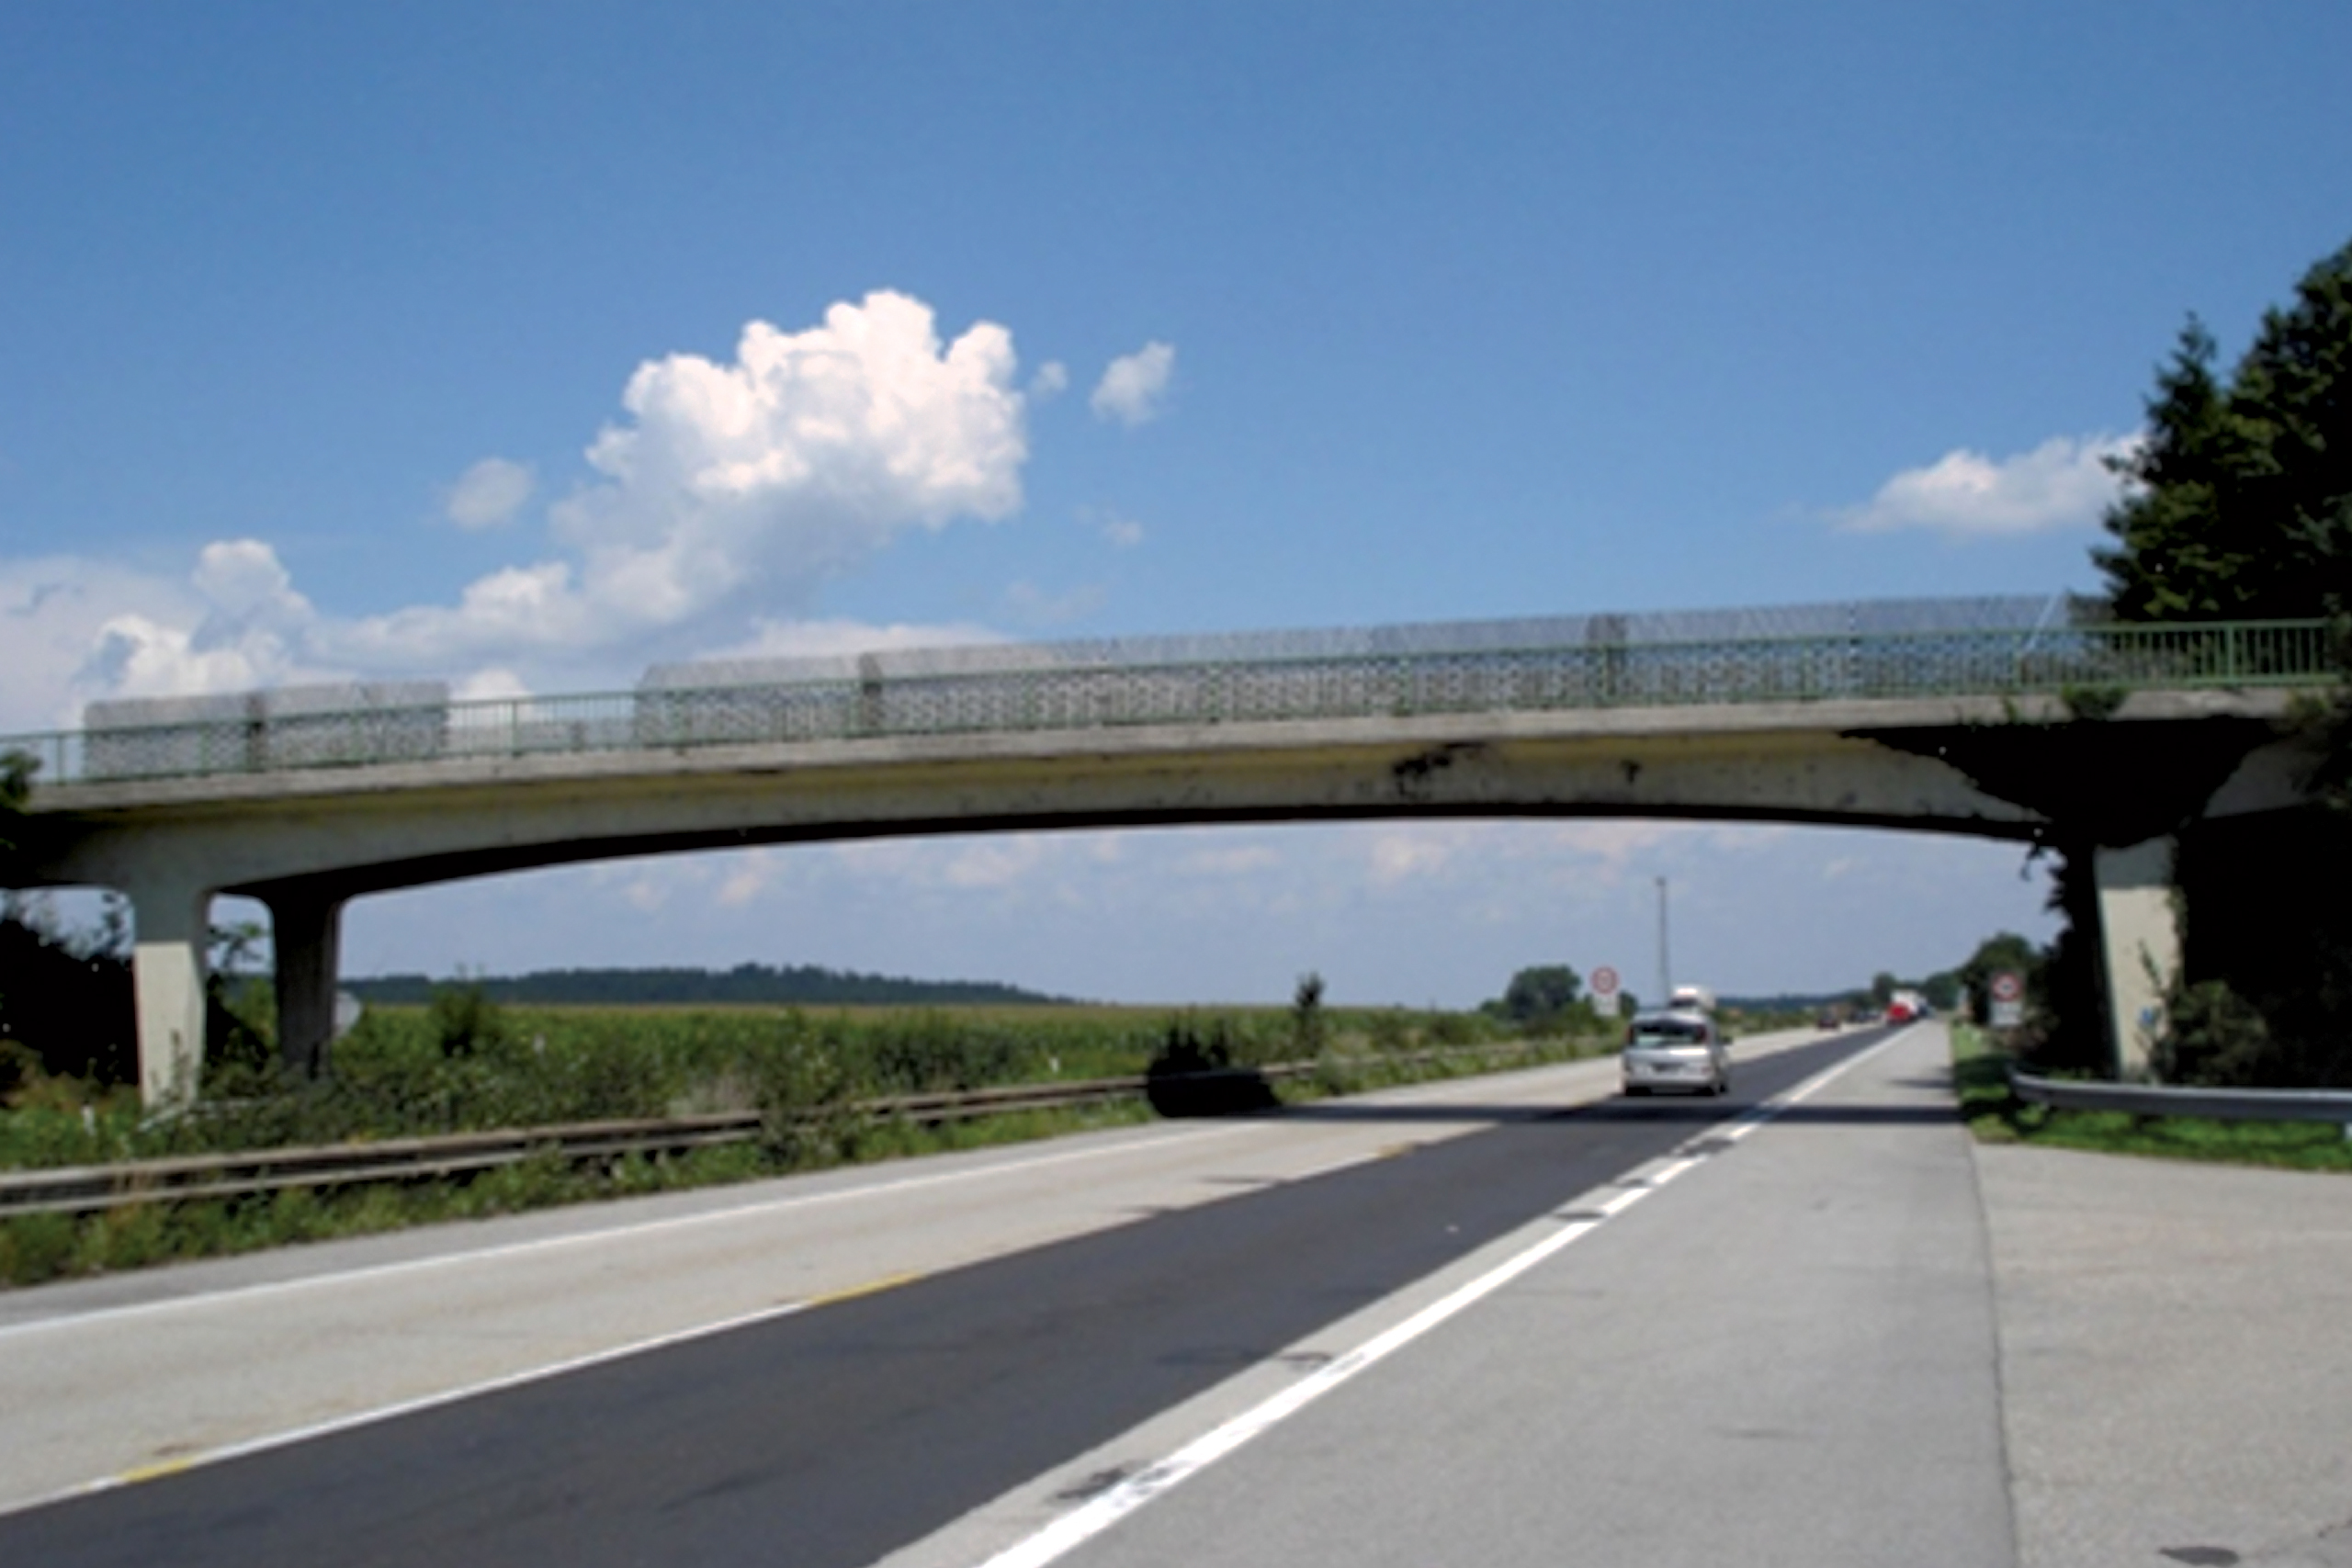
Built in 1960, it had to be demolished due to structural problems and to allow space for additional lanes on the highway underneath. That created an opportunity for conducting progressive structural damage tests. The bridge was artificially damaged and monitored within the Integrated European Industrial Risk Reduction System research project. The measurement campaign was conducted by VCE and the University of Tokyo. The purpose of the campaign was to demonstrate the impact of scientific insight and findings with regards to the rehabilitation measures and cost planning of the transportation infrastructure.
Acceleration responses were recorded using 15 triaxial sensors mounted on the bridge deck. The bridge was monitored continuously from the 10th to the 13th of December 2008. A sampling frequency of 500 Hz was used and a total of 714 data sets with 165k samples in each were acquired.
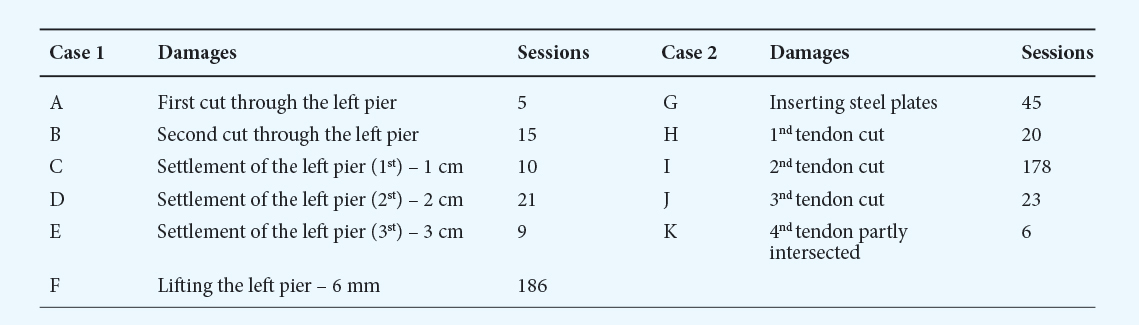
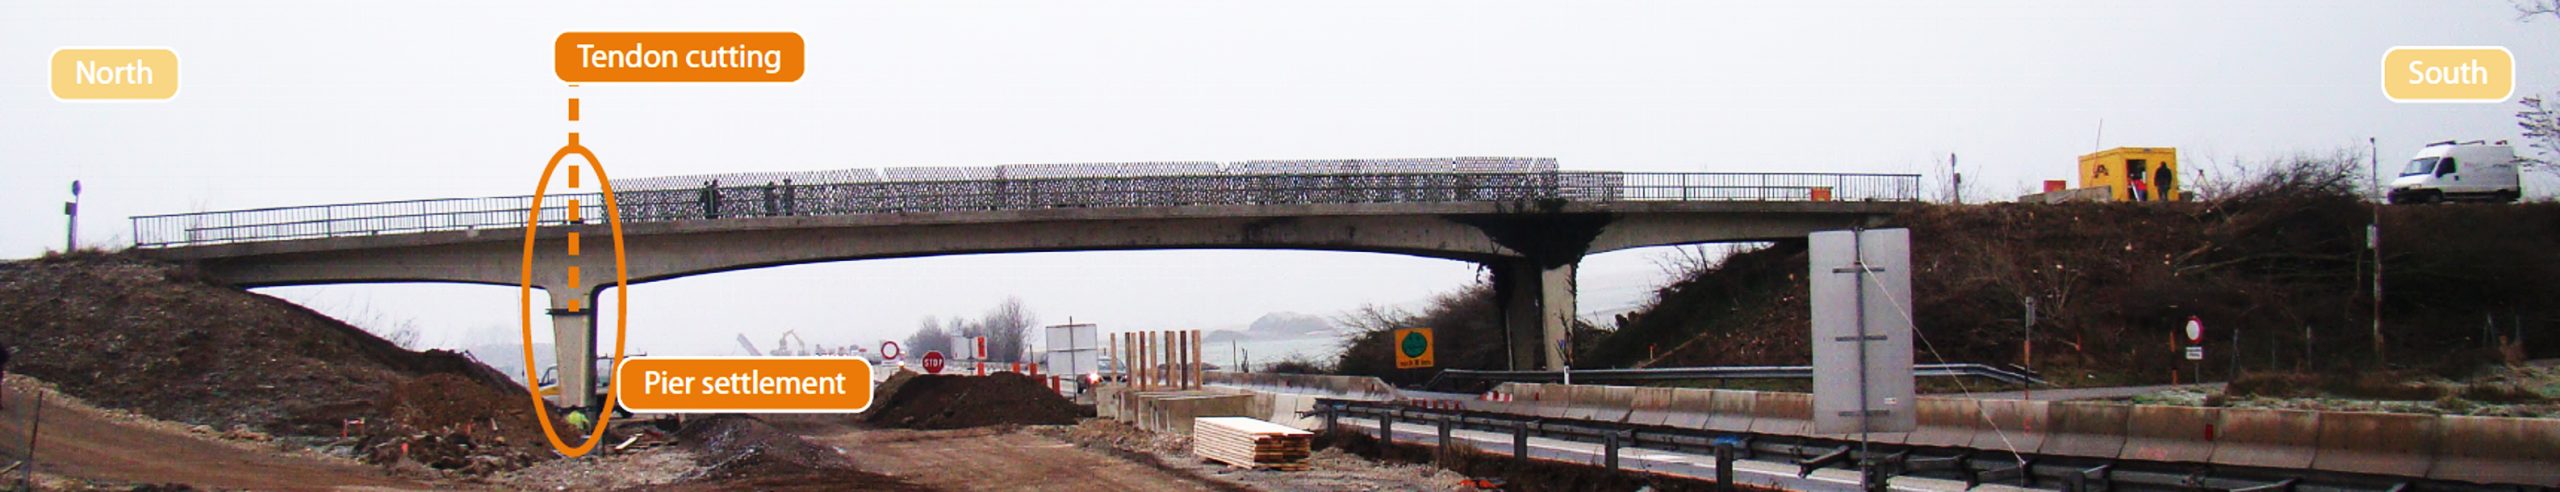
The bridge was closed for any traffic during the progressive damage testing. As a result, the main source of ambient excitation was wind and the vibrations from traffic on the highway beneath the bridge. The structural damages introduced in the bridge were of several types and locations. Two major damage scenarios can be distinguished, as outlined in Table 1.
The initial analysis, called the Master Session, was made in the desktop version of the ARTeMIS Modal Pro software. Here the geometry was prepared, and the first measurement file was uploaded, and measurement channels were linked to specific geometry nodes and directions.
The required signal processing was then configured. This includes detrending, decimation, spectral estimation and automatic operational modal analysis using the SSI-UPCX Stochastic Subspace Identification estimator. The signal processing settings made in the master session has then been used in all subsequent analysis sessions.
The first 100 measurement files, all assumed to be in a healthy reference state, were imported into respective analysis sessions and analyzed. The reference state for damage detection was created using the first 100 healthy analysis sessions. Based on the modes of the first 10 reference analysis sessions 4 reference modes were identified. These reference modes are computed as averages of similar looking modes across the 10 analysis sessions.
After having initialized mode tracking and damage detection, the desktop version of ARTeMIS Modal Pro was closed and the SHM Automation Service took over the file upload, analysis and storage of results.
In total, 681 out of 714 measurement files were uploaded and investigated for damages. The rest of the measurement files were corrupted during the data acquisition.
The service can be stopped at any time to allow the desktop version of ARTeMIS Modal Pro to display the results. This was done after processing of all available measurement files and below the results can be seen.
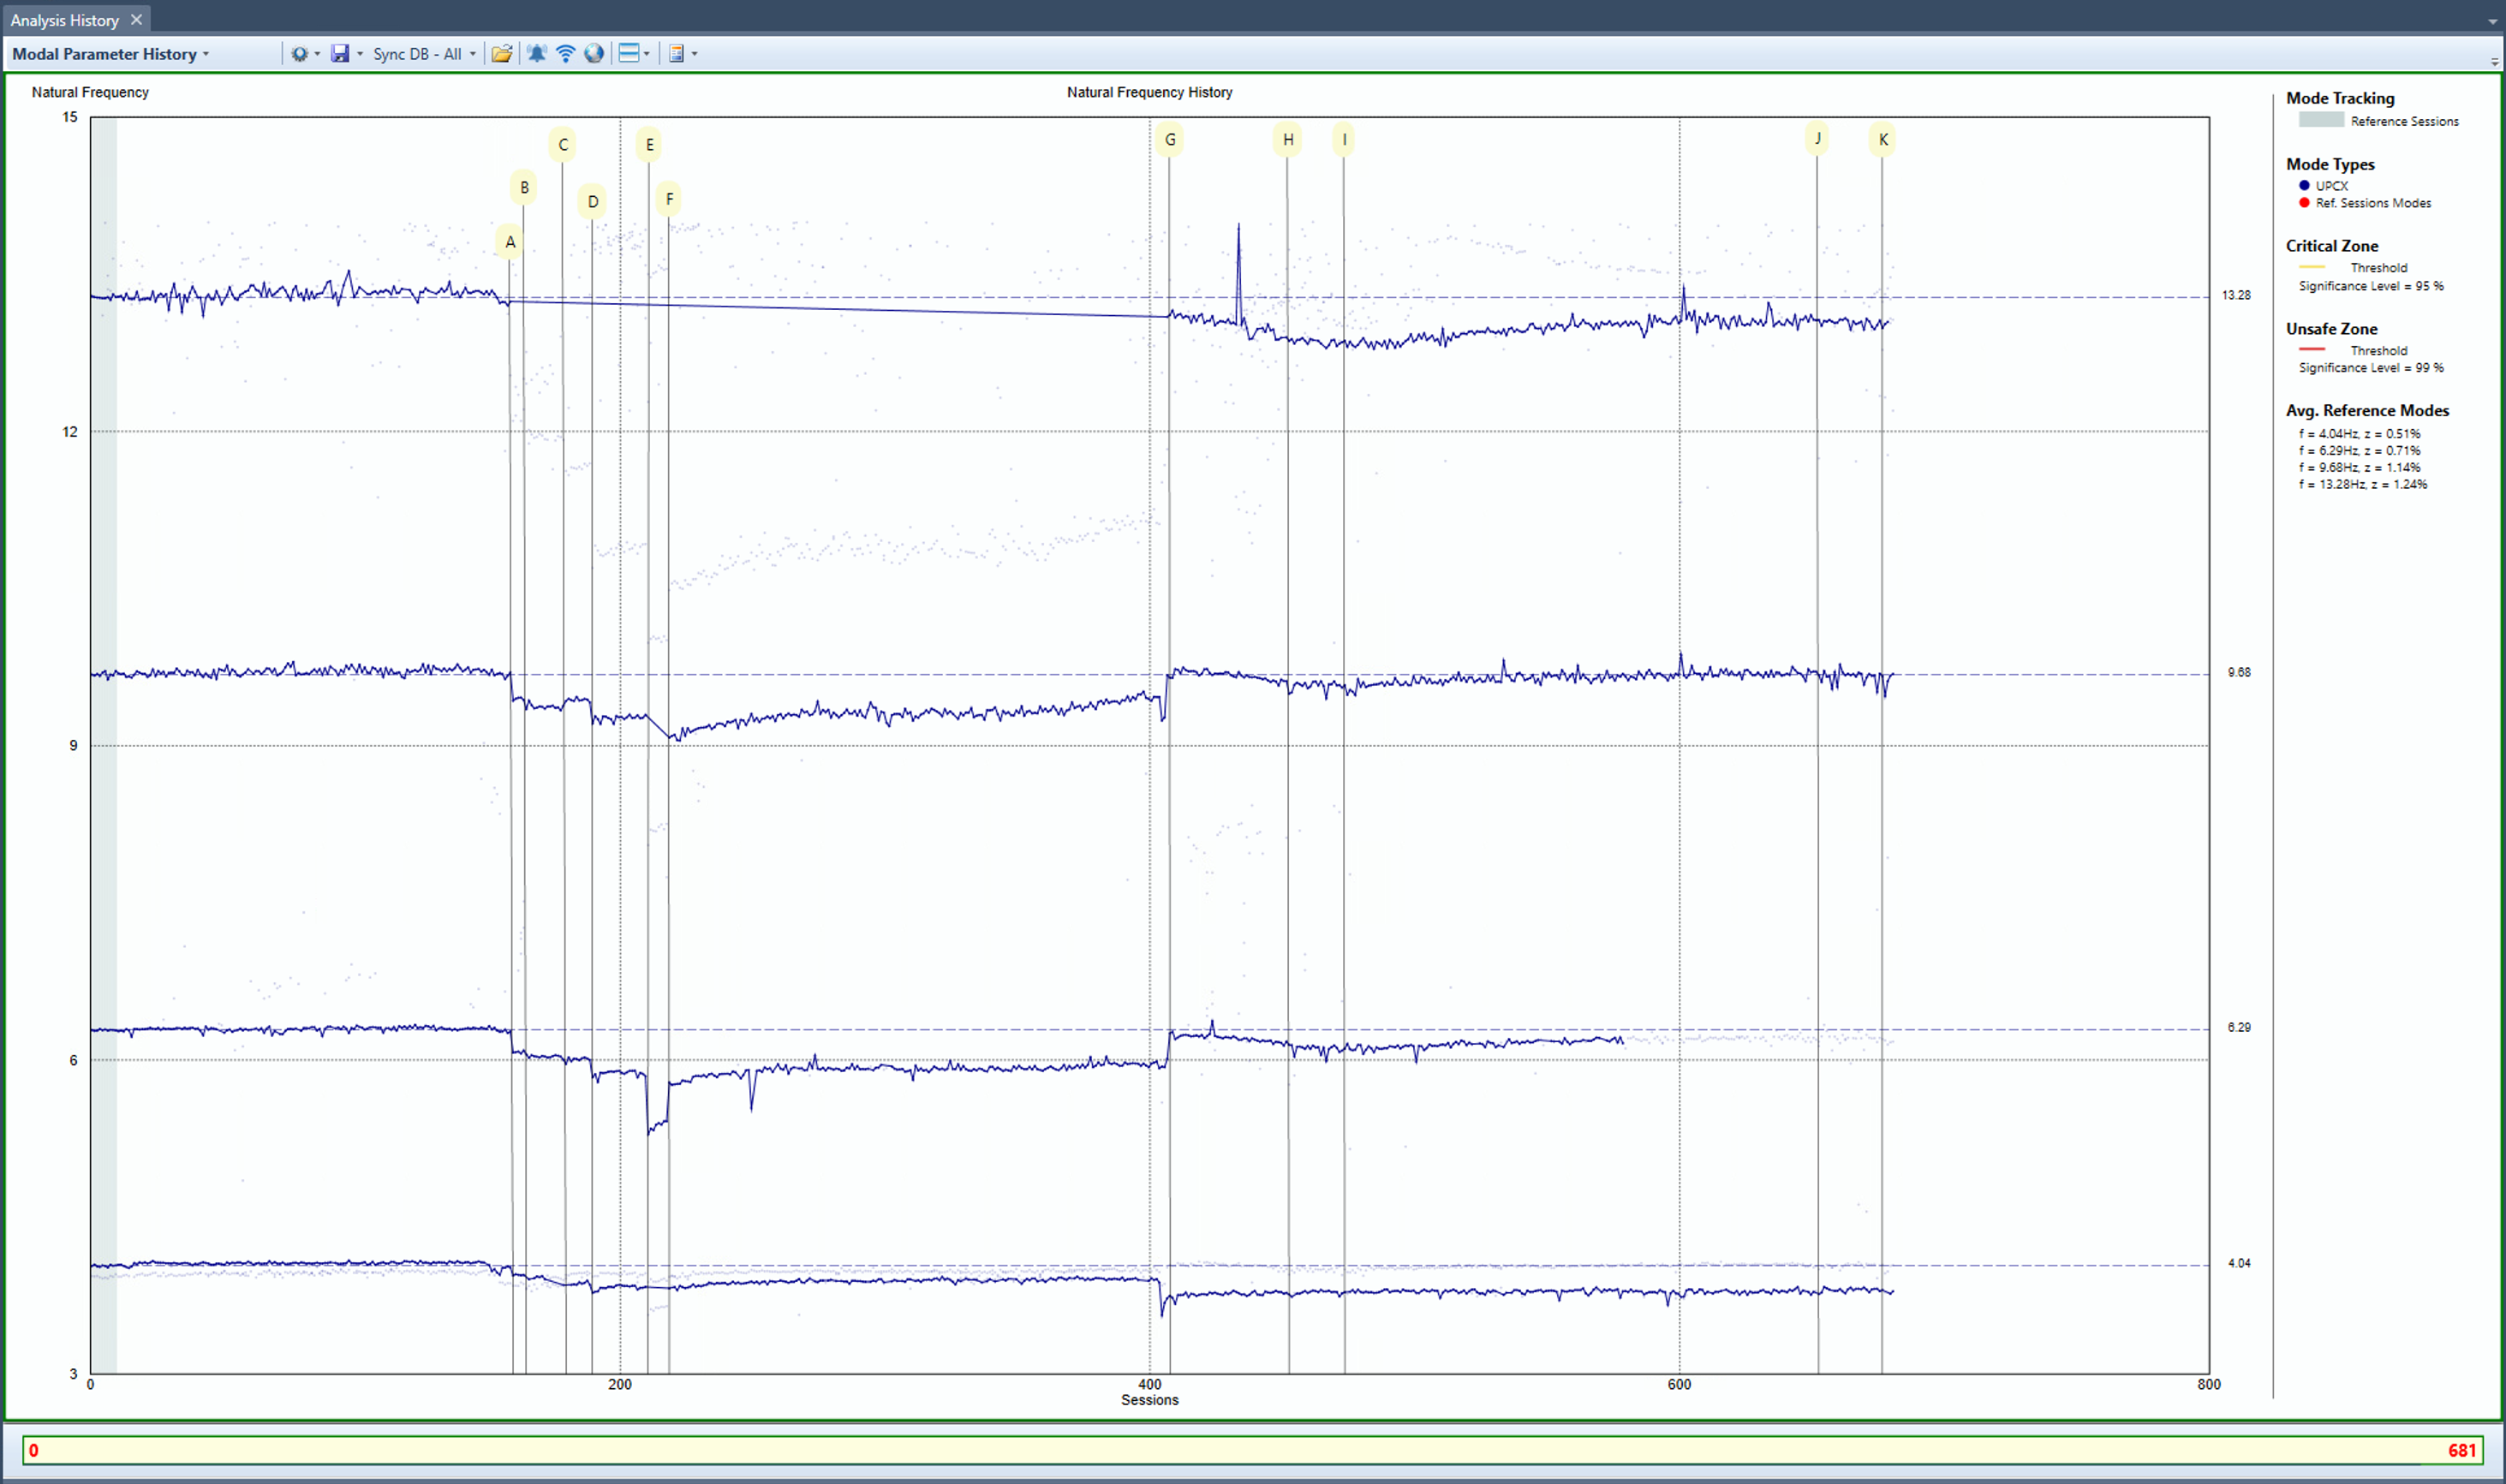
The first 4 modes obtained with the SSI–UPCX method and tracked across the 681 analysis sessions are shown in Figure 4. At the moment the initial damage is introduced, indicated with an annotation A, it is clear to see a significant drop in the tracked frequencies.
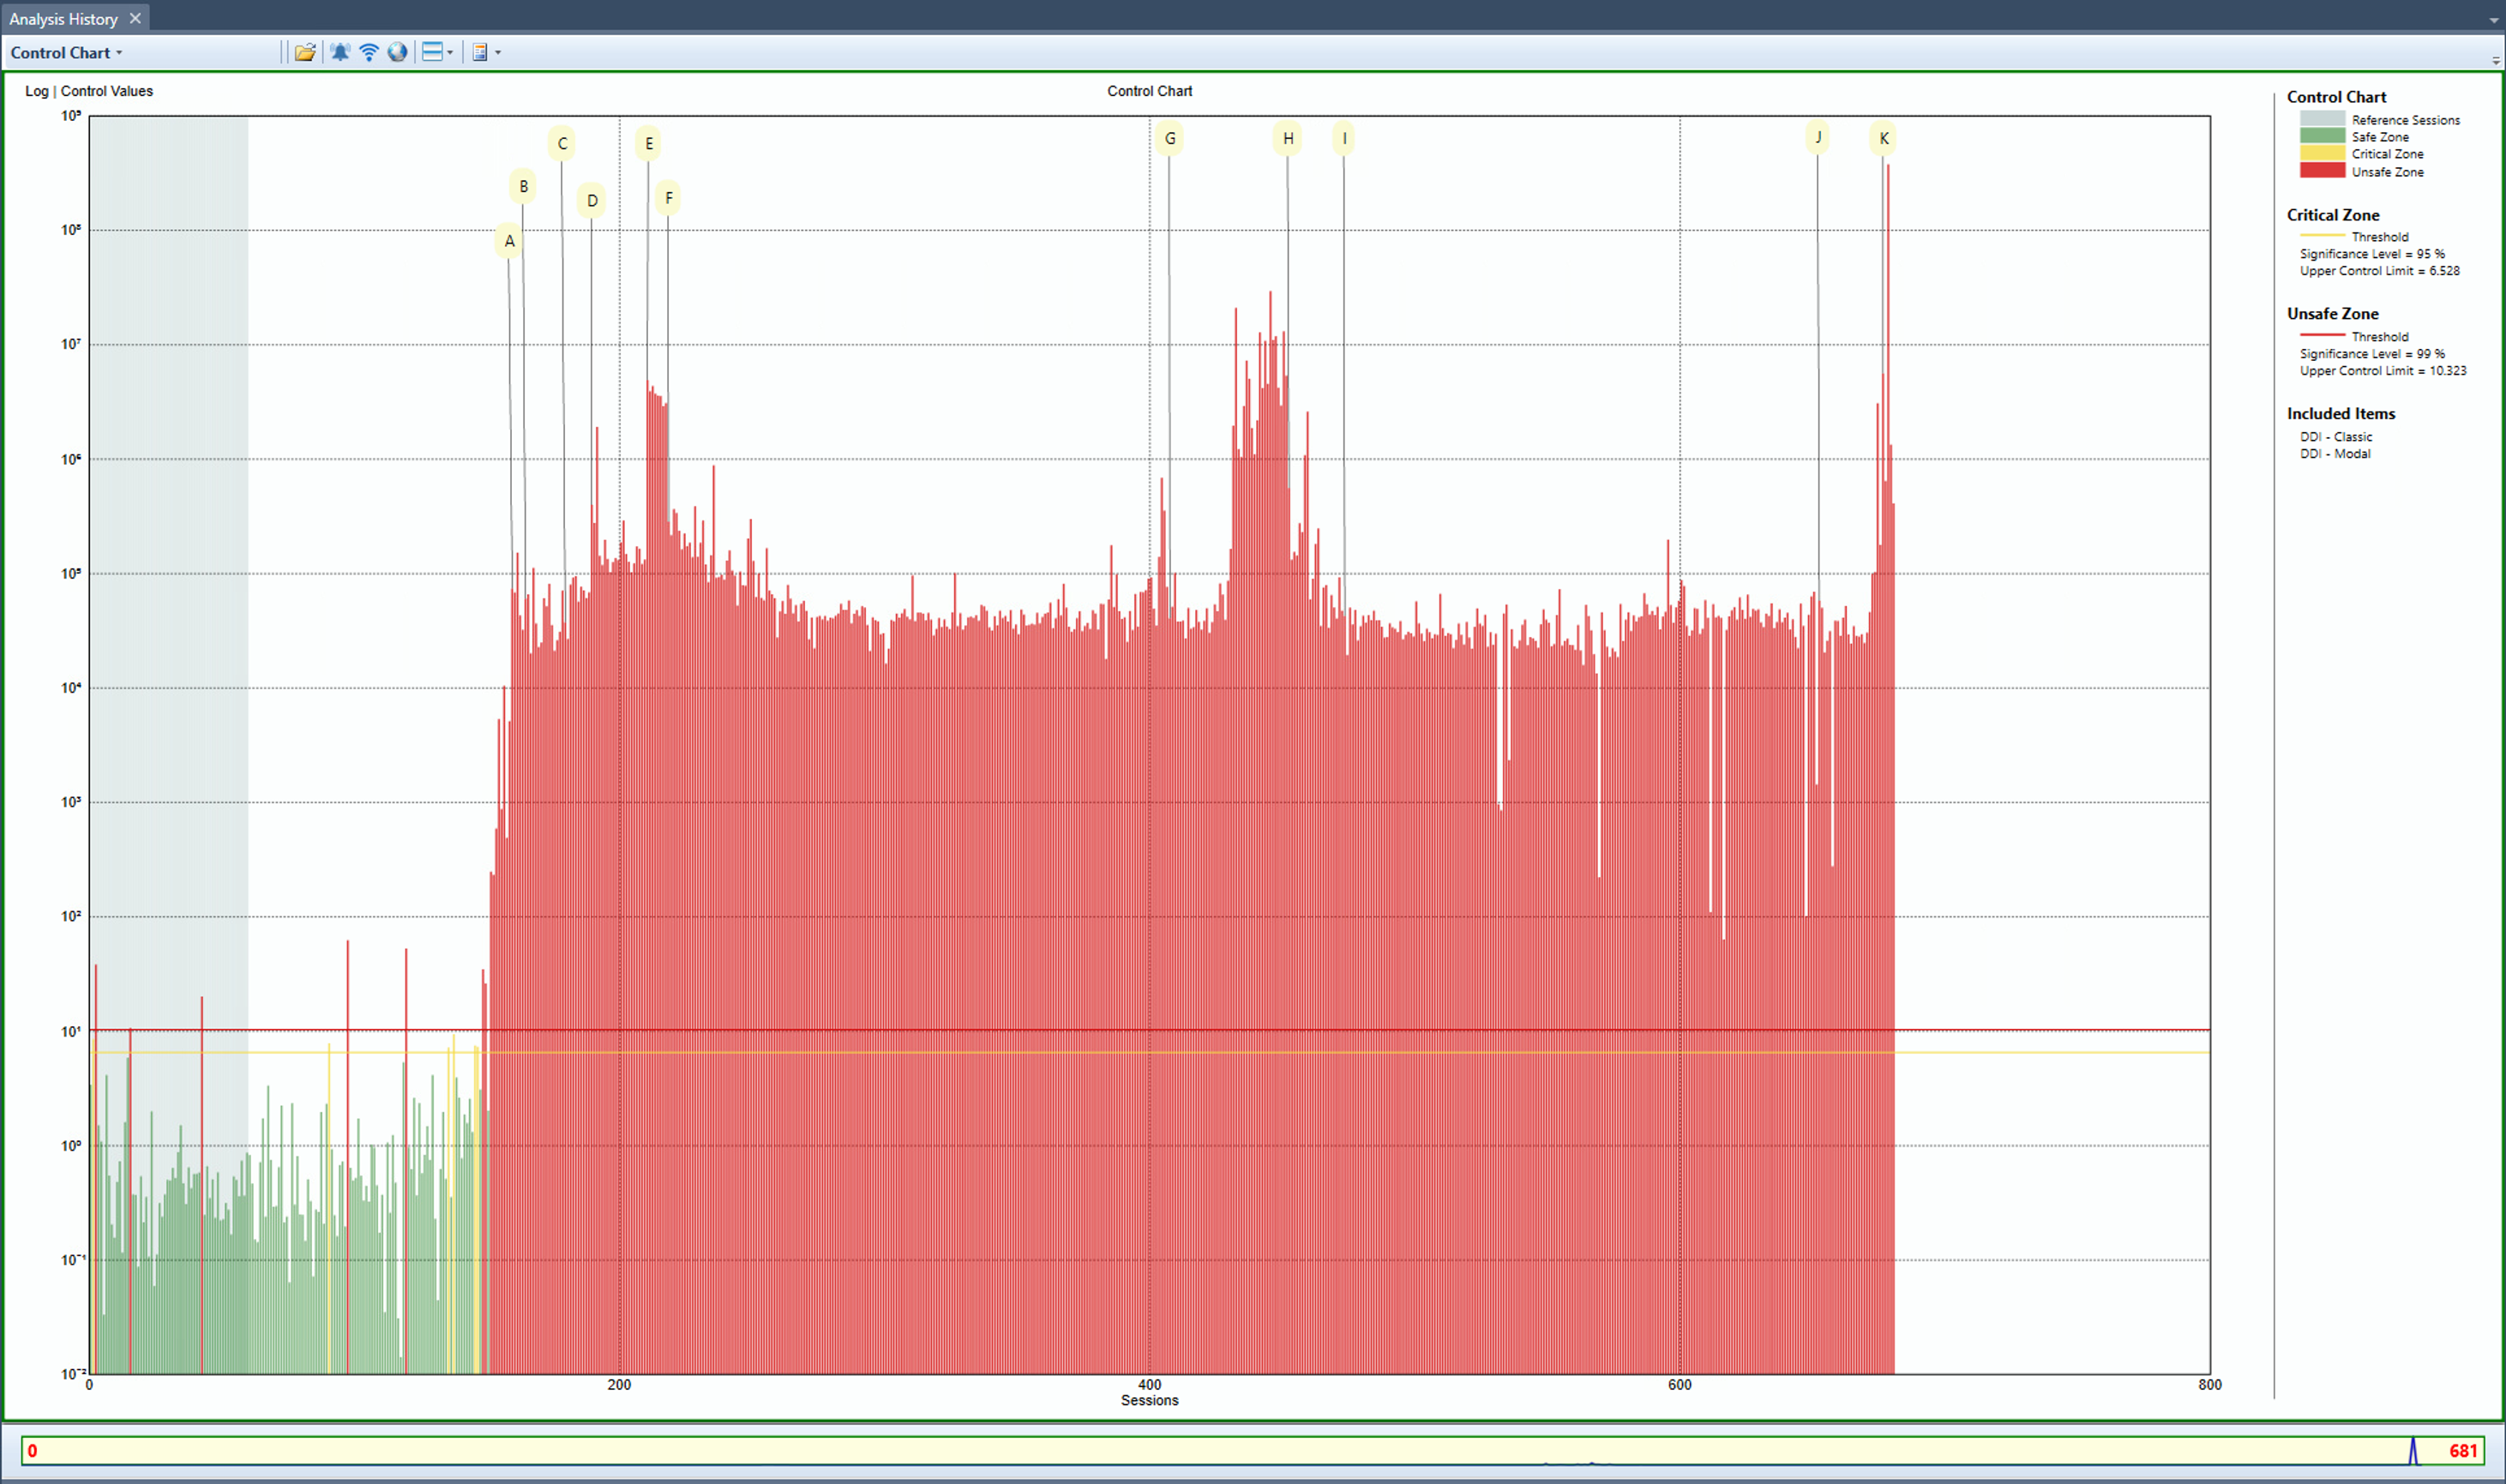
Three damage detection tools where used. These the modal, classic and robust damage detection. For illustration, the damage indicators of modal and classic were joined together in the control chart shown below in figure 5. The control chart enhances the damage indicator quality and compensate for any drawbacks of each of the two individual damage indicators. There are very few false alarms in the reference range, and there is a clear reaction to the damages introduced.
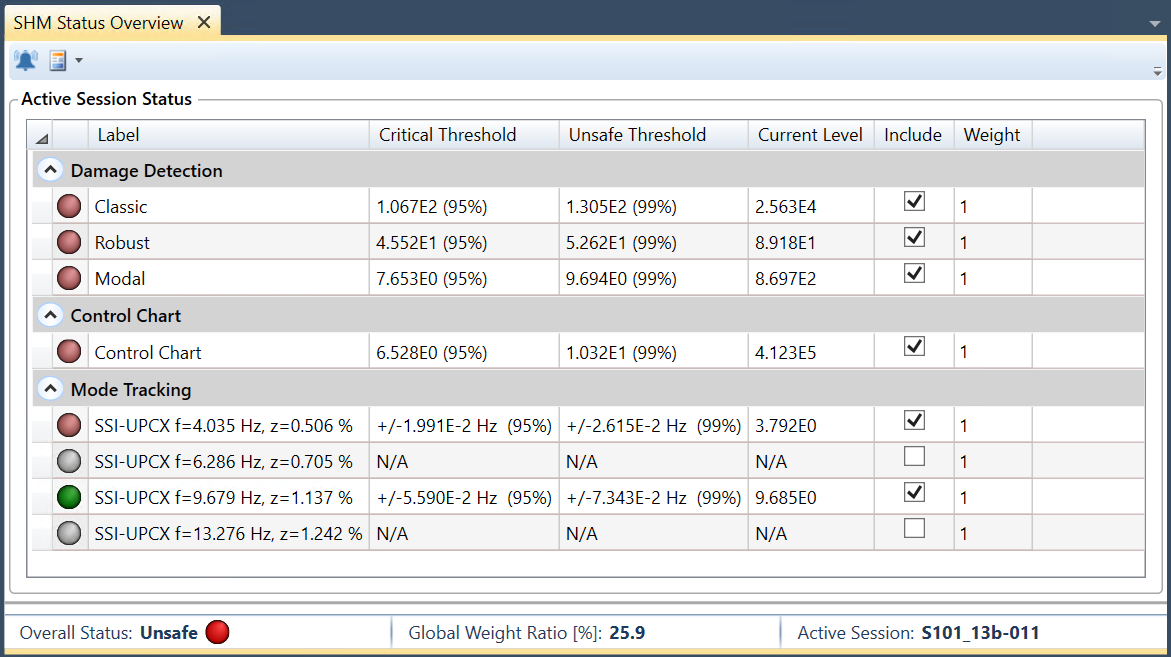
SHM Status Overview
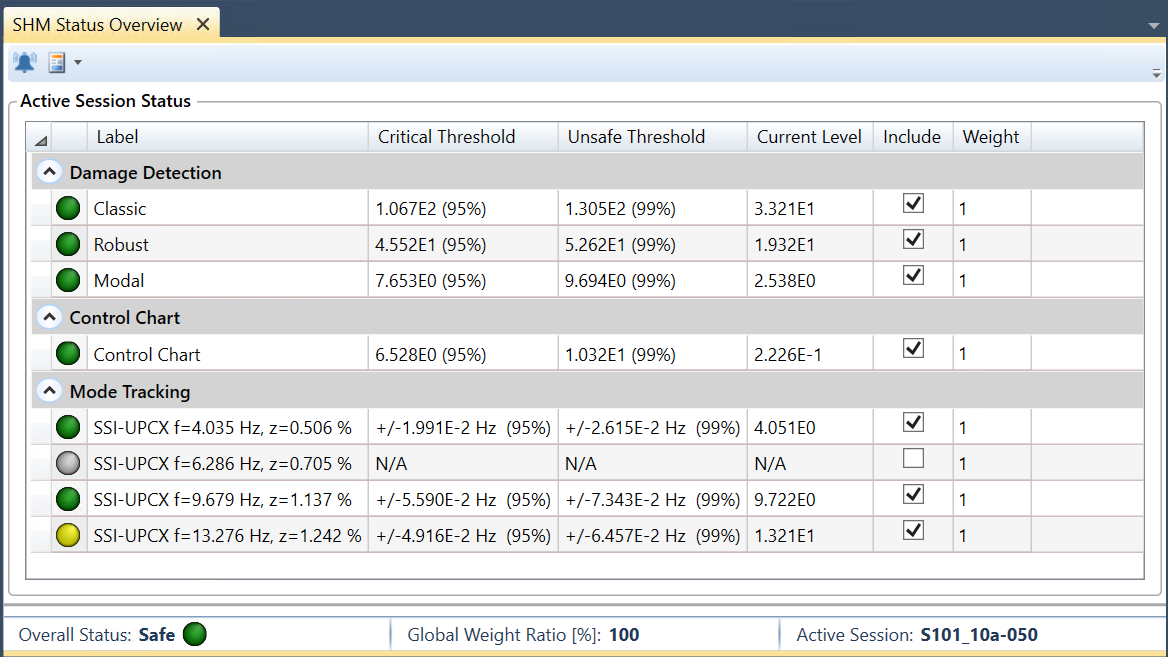
For each of the tracked modes and the damage indicators there are two thresholds calculated based on statistical confidence levels. The first threshold indicates a critical change and is typically related to a 95% confidence level. In order words, there is 95% probability that a change of the parameter has happened. The second threshold indicates an unsafe change and is typically related to a 99% confidence level. Below the critical threshold, the parameter is in the safe region.
Based on threshold it is possible to determine which of the tracked modes and damage indicators that has changed significantly, and to calculate a global measure for the overall health of the structure.
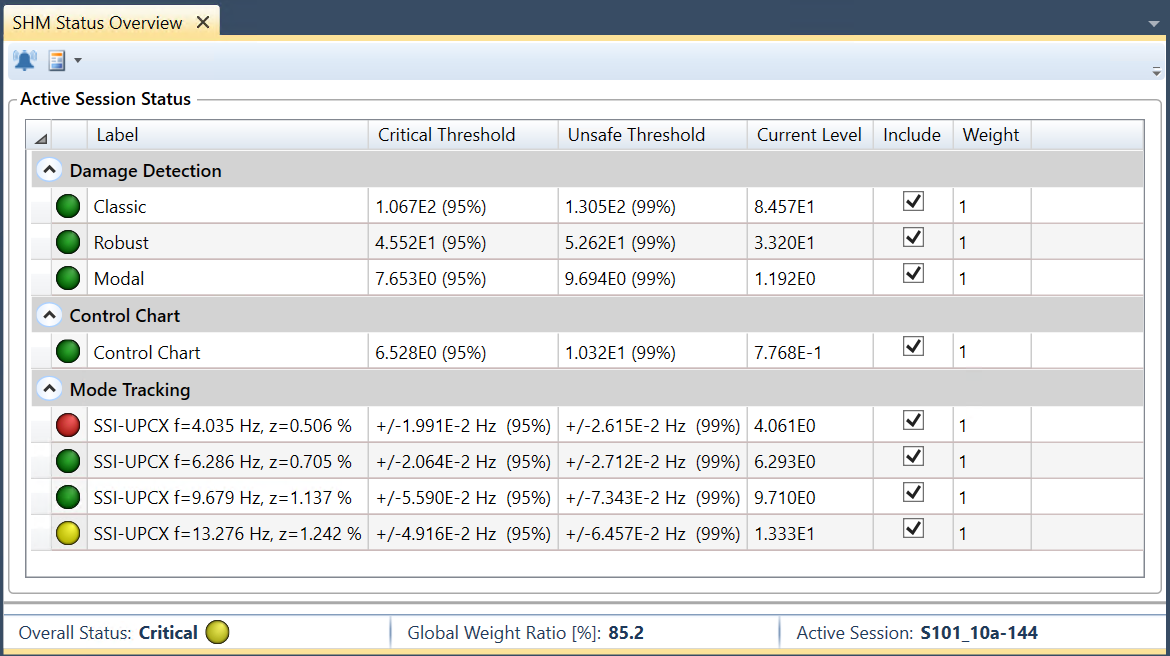
Below there are three figures that present the SHM Overview window listing the status of the four tracked modes and damage indicators. Figure 6 presents status of an analysis session in the reference range that is characterized as safe (green). Figure 7 is from an analysis session where the initial damaging was initiated. Here the overall status is critical (yellow). Finally, figure 8 is the last available analysis session. In this analysis session the bridge has suffered significant damage and the overall health status is now unsafe (red).
The overall health status for an analysis session is a weighted average of all available tracked modes and damage indicators. This weighted average is a value called Global Weight Ratio that is presented in percent.
Based on this value the overall health status is defined as:
100% >= Safe > 90% >= Critical > 50% >= Unsafe >= 0%.
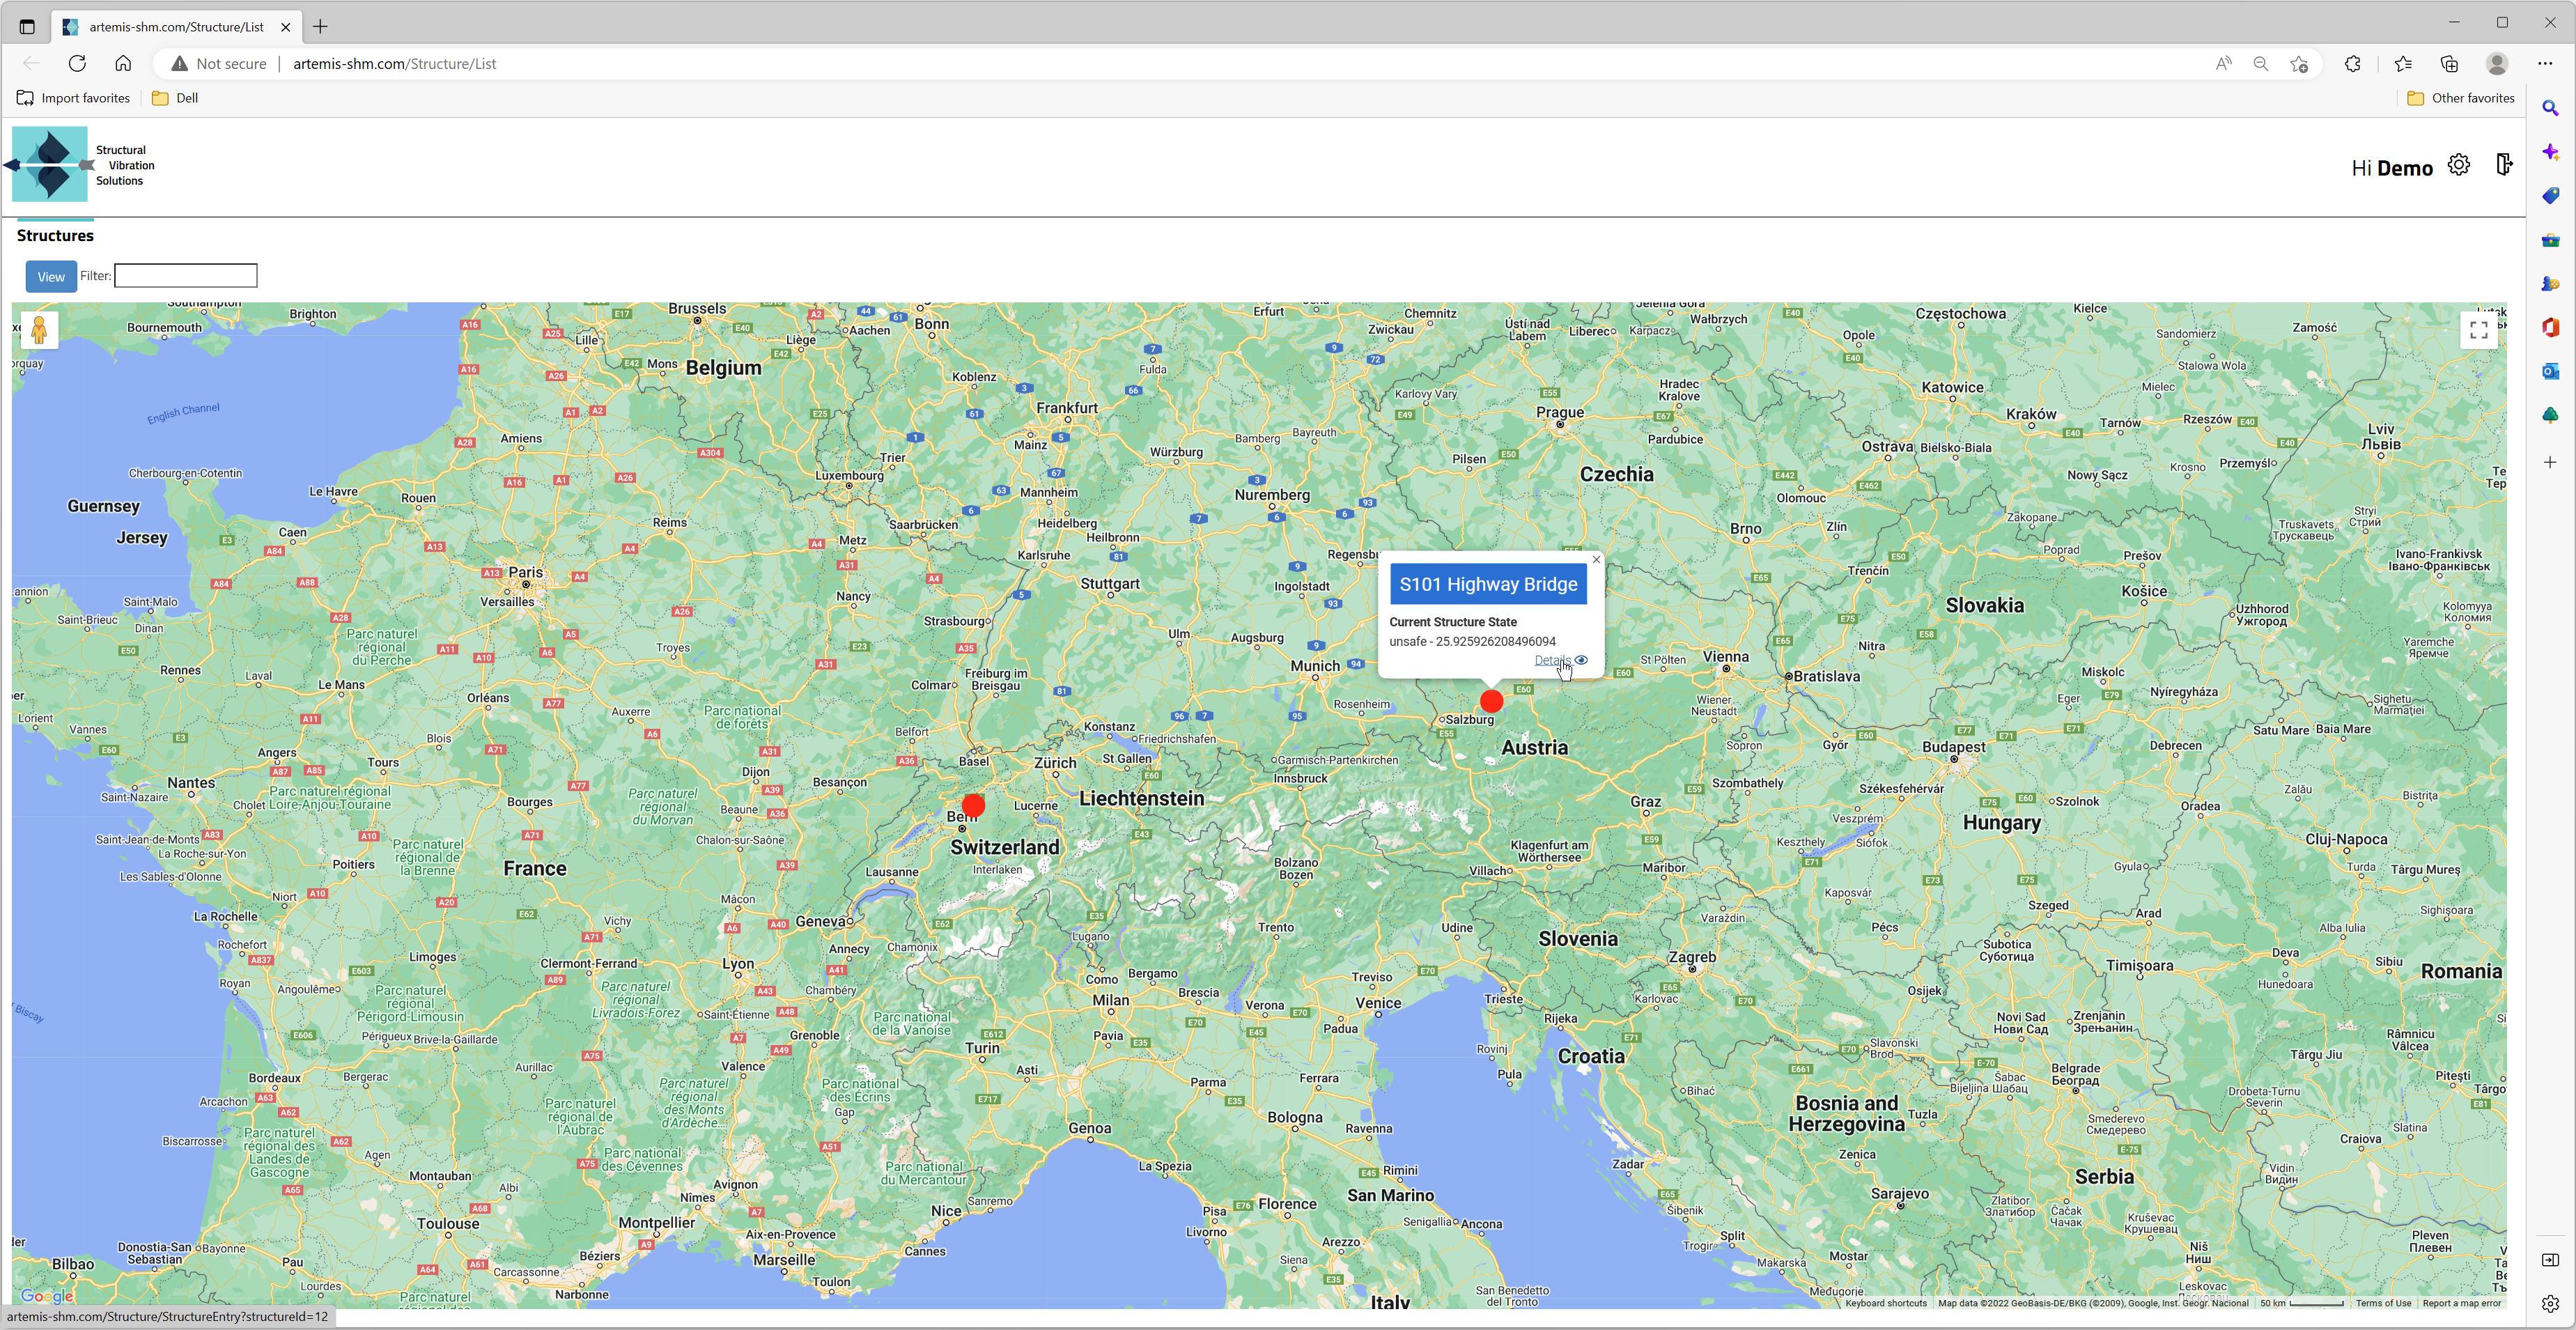
In the ARTeMIS-SHM the results are stored in the ARTeMIS Modal project files but also in an SQL database. The database storage allows presentation of results for multiple users through a web browser. From the web site www.artemis-shm.com users can get results displayed of a specific analysis sessions as well as their historical development.
The web site is accessed by logging into a user account associated with an organization. Please contact svibs@svibs.com to get your own demonstration login to the S101 highway bridge results.
Once a user is logged in, the structures the user account is associated with appear on a map as dots with colors reflecting their current overall health status. Clicking at the dot of a structure the user is directed to the structure’s portal.
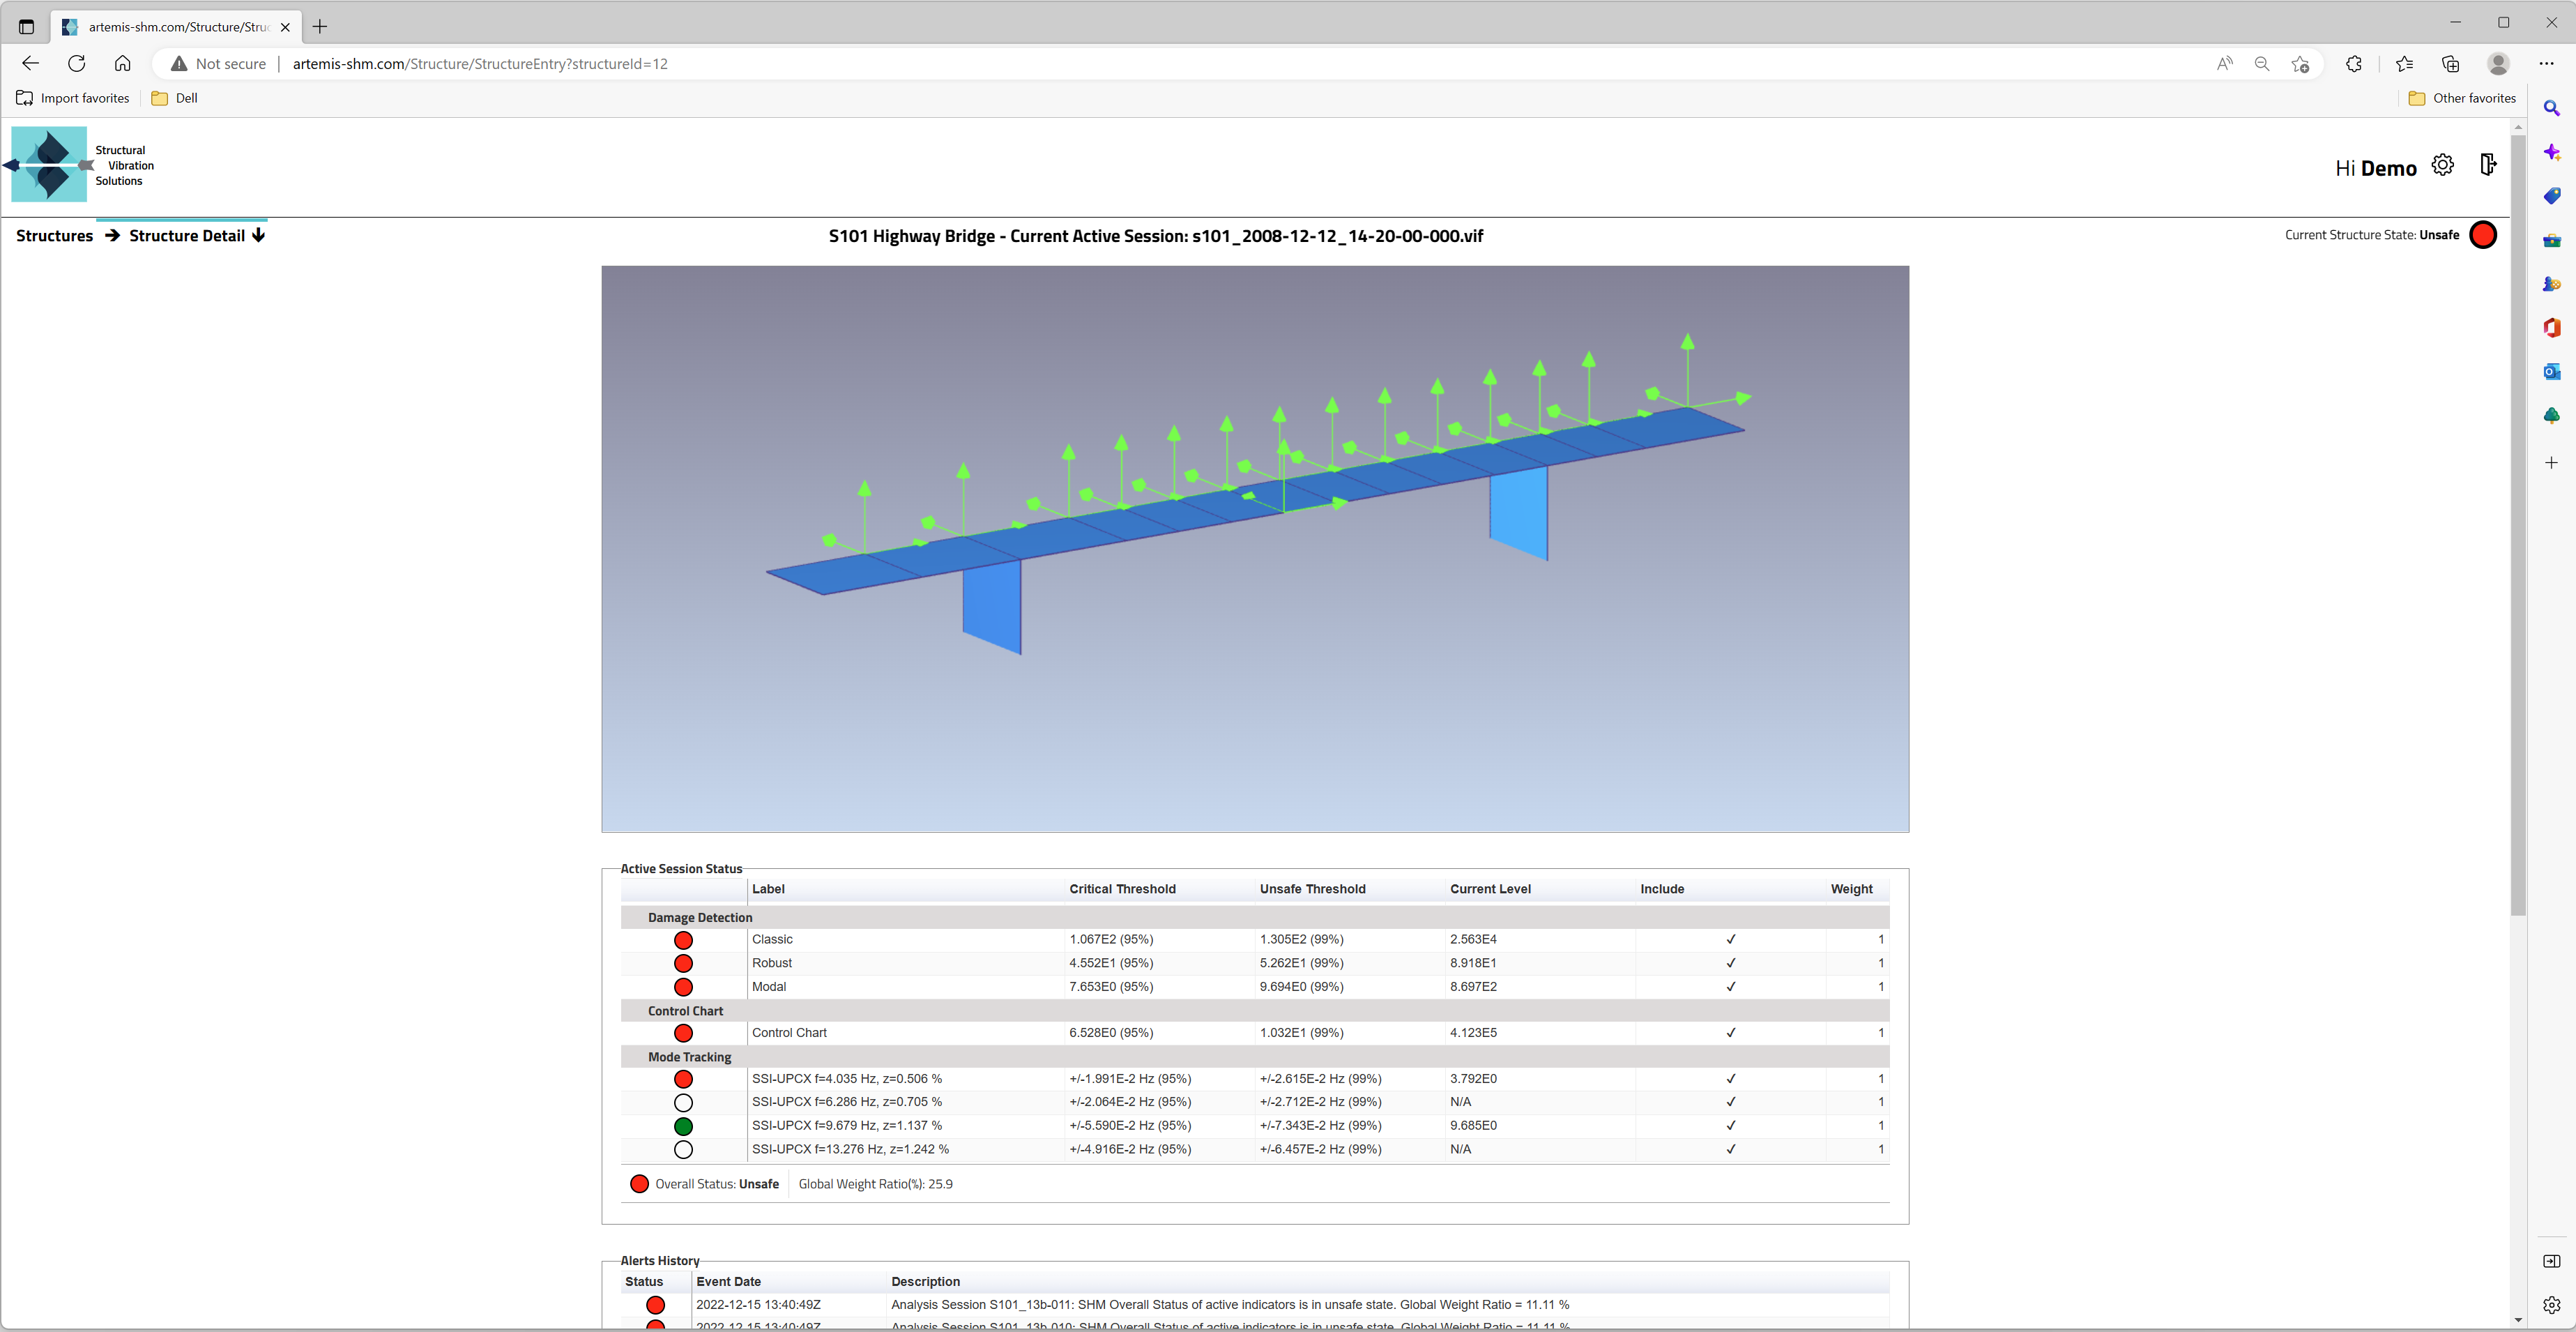
In the portal of the structure, the current overall health status and the state of the tracked modes and damage indicators can be viewed on the Structure Details page. Here it is also possible to see an interactive geometry of the structure with the sensor locations as well as the latest alerts.
In the Structure Analysis page, it is possible to select and animate any of the estimated modes of any of the analysis sessions. By default, it is always the last analysis session that is selected. To select mode animation the geometry component and the mode table of the active analysis session should be selected from the navigation tree to the left. In figure 11 this is shown. The selection of modes and animation has the look and feel of ARTeMIS Modal.
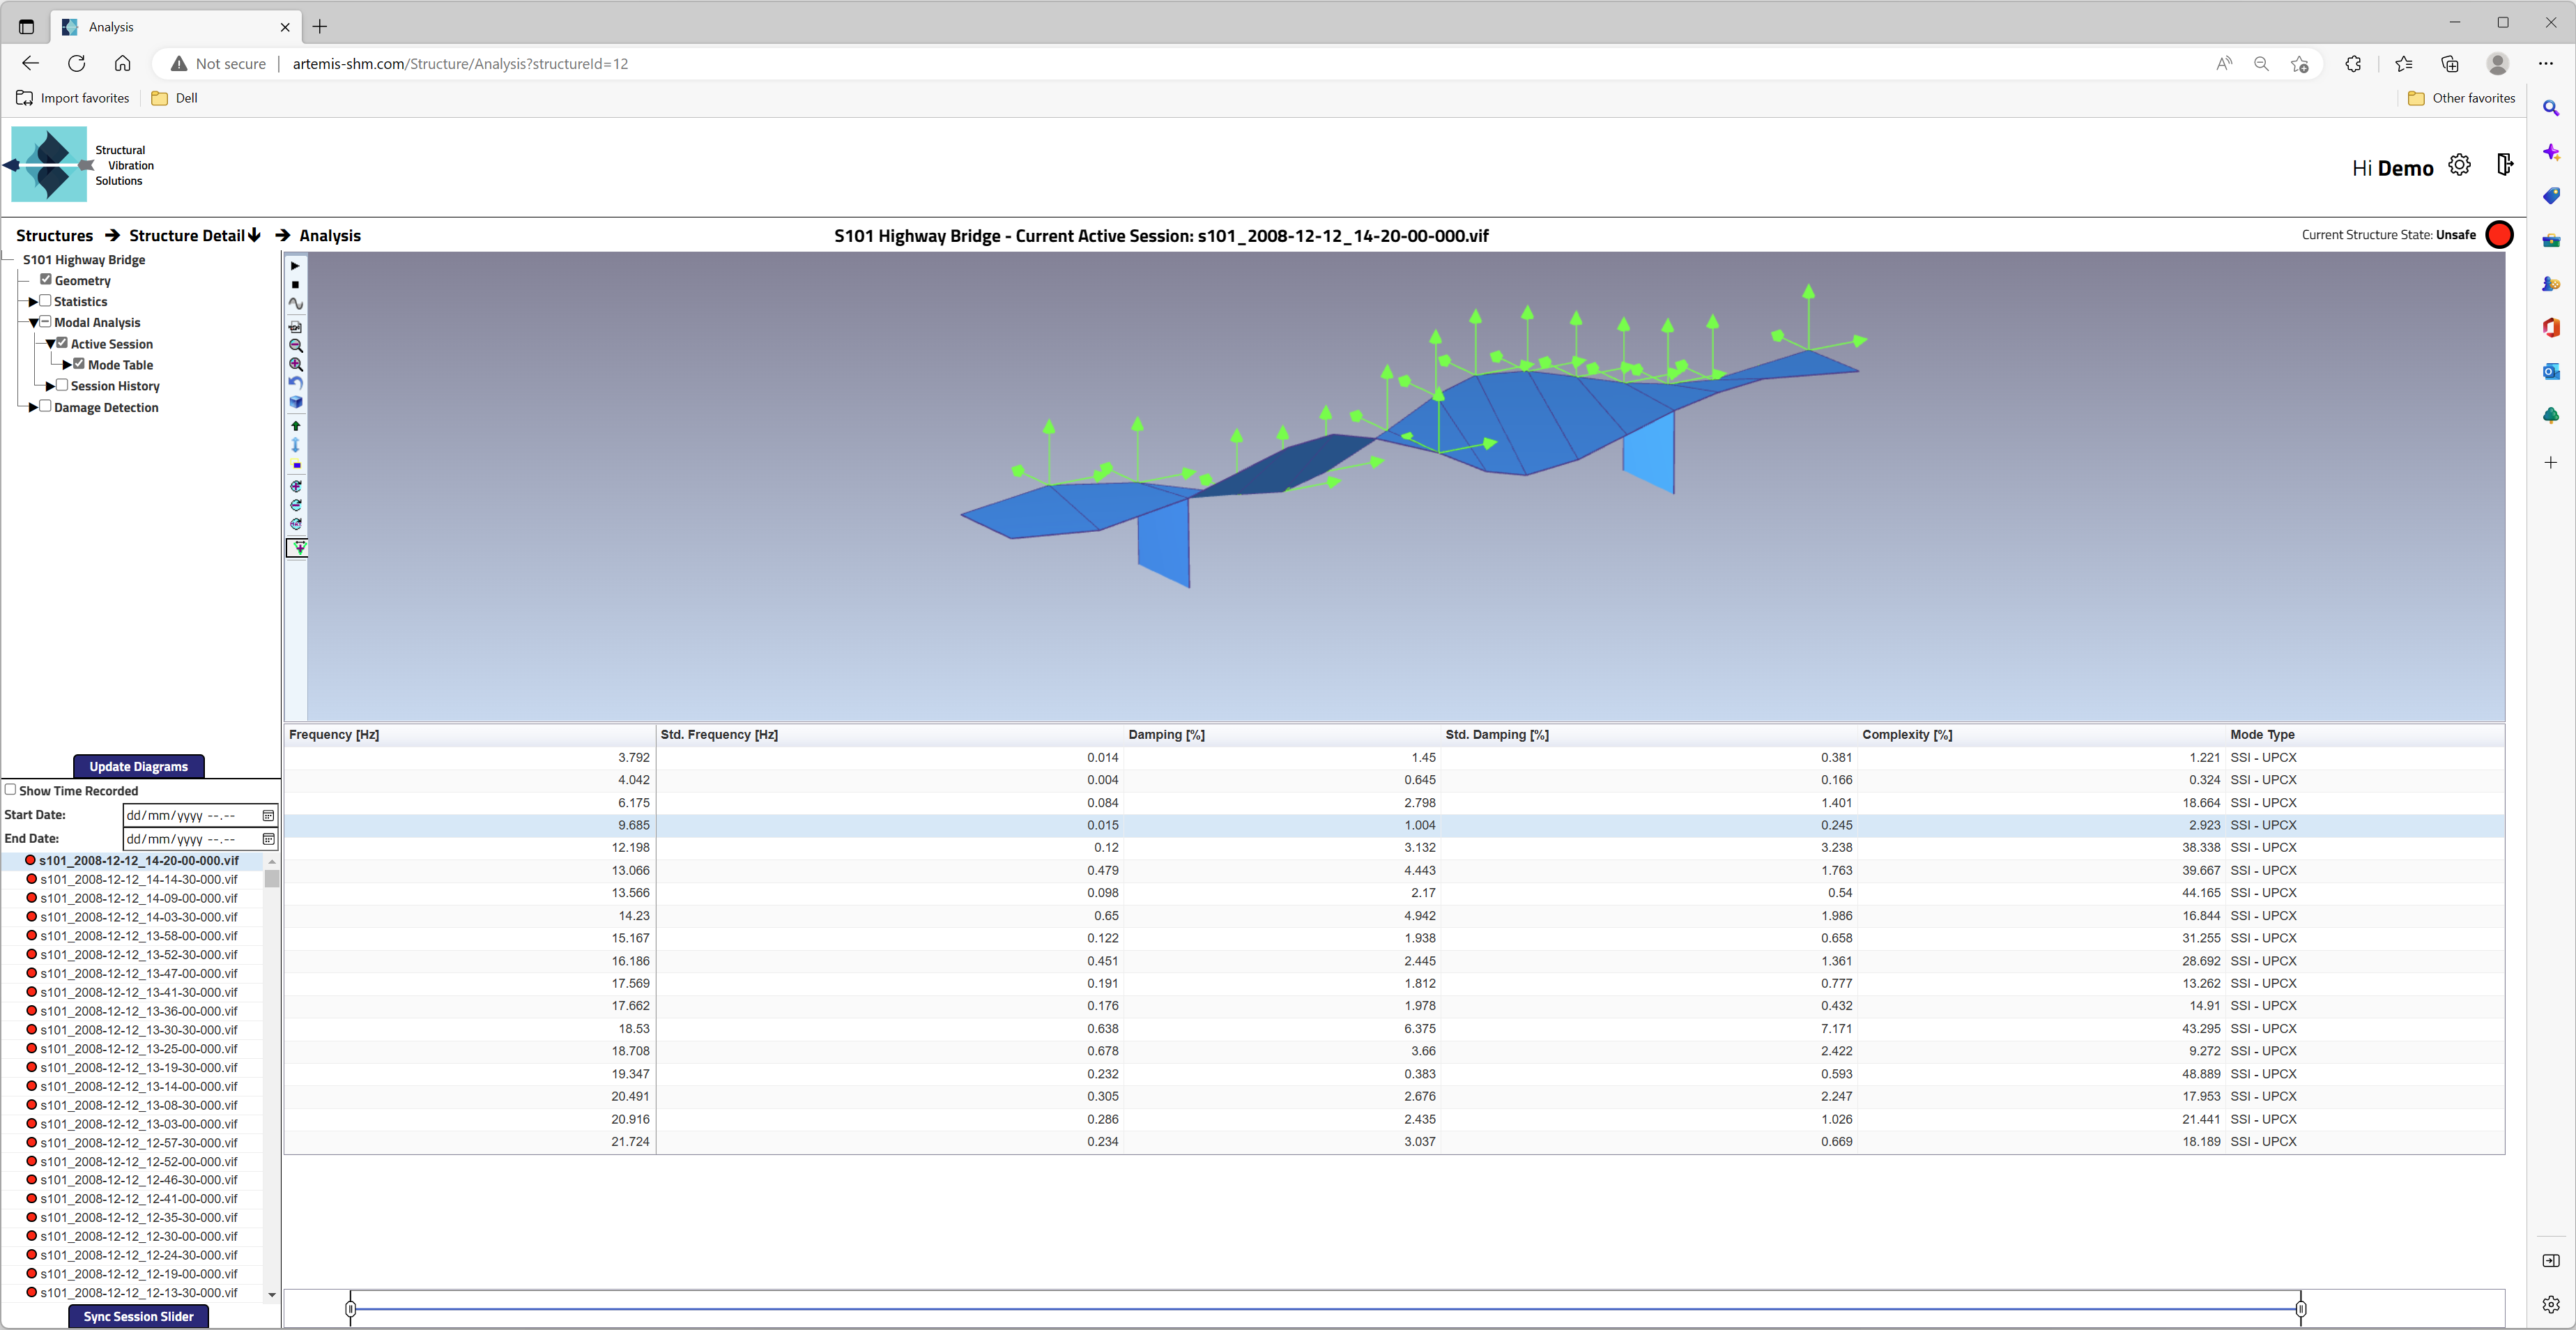
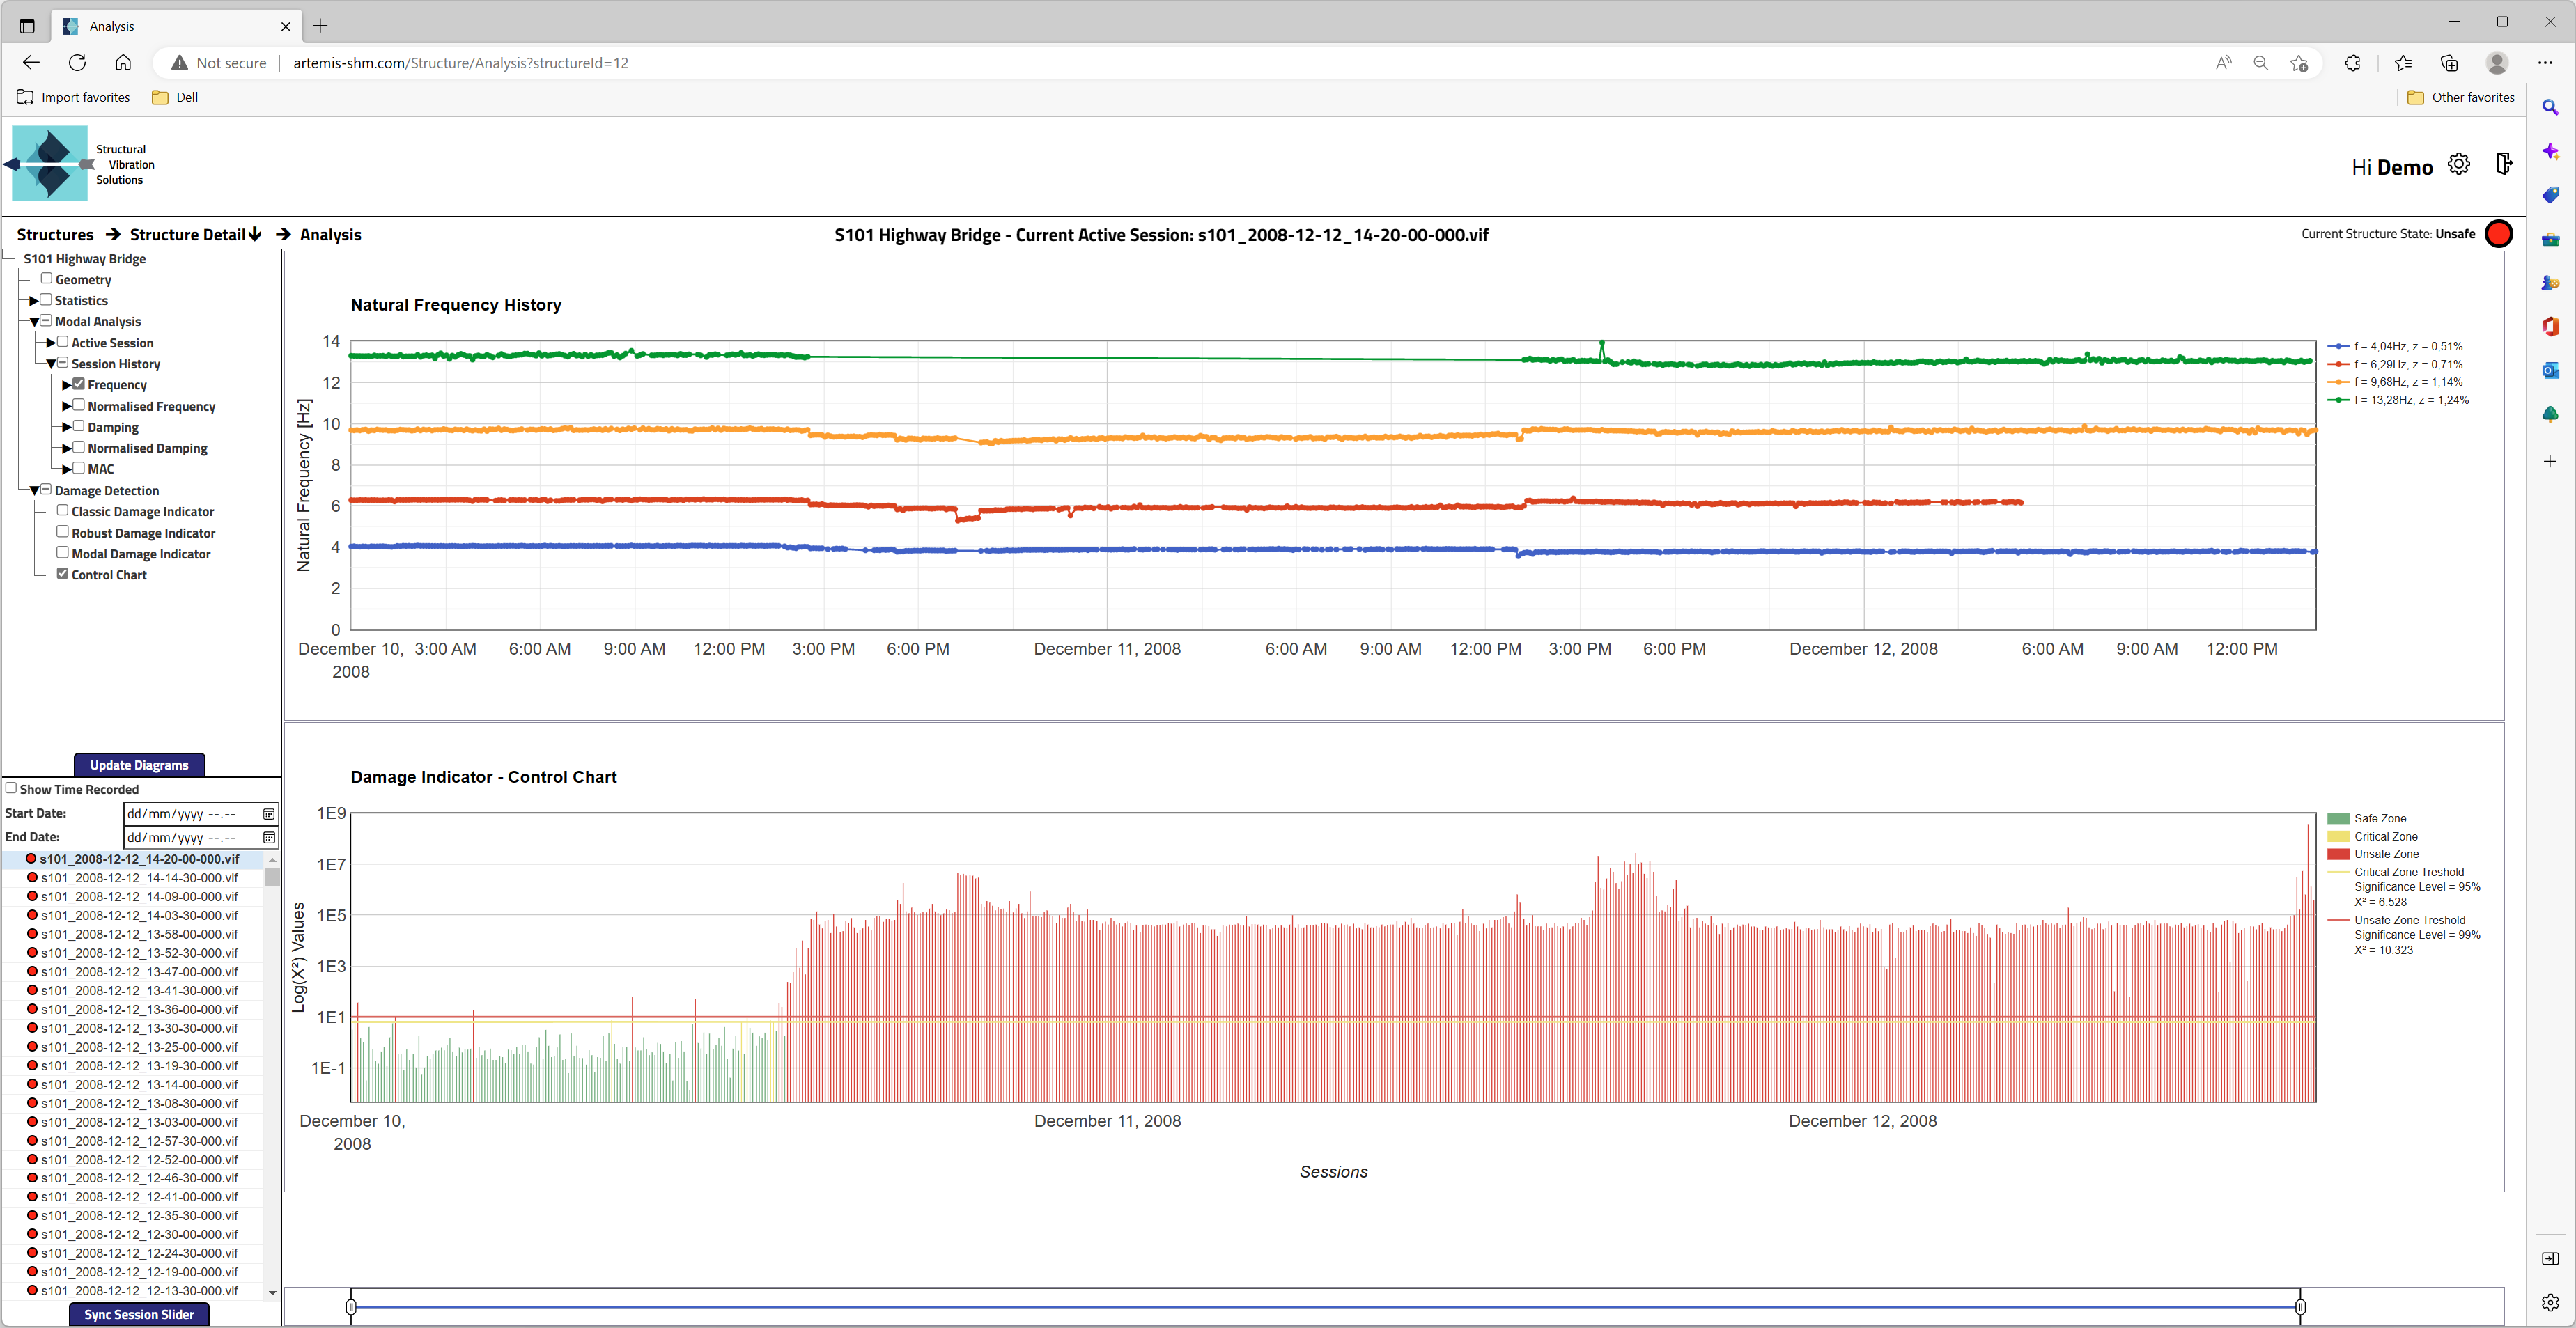
To view the historical development of tracked modes and damage indicators, these components are selected from the navigation tree. Below the natural frequencies of the tracked modes are shown along with the control chart. This information is equivalent to what is shown in figure 4 and 5.
ARTeMIS-SHM can through administration login at www.artemis-shm.com configure what type of reports and notifications users should get. In general users can receive SMS and email notifications which are short messages including a link to a report. The reports are accessed through the web site and can be downloaded to PDF files from there.
N.J. Jacobsen, P. Andersen, A. Mendler, S. Gres: A general framework for damage detection with statistical distance measures: Application to civil engineering structures. Proceedings of the 8th International Operational Modal Analysis Conference (IOMAC) Vancouver, Canada, 2022.
M. Döhler, F. Hille, X.B. Lam, L. Mevel, W. Rücker:
Confidence Intervals of Modal Parameters During Progressive Damage Test.
Proceedings of the 29th International Modal Analysis Conference (IMAC) Jacksonville, Florida USA, 2011.
Palle Andersen
Managing Director, Ph.D.
Niels Jernes Vej 10
9220 Aalborg East, Denmark