Search

This case study presents an Operational Modal Analysis made using the SSI-UPC Merged Test Setups algorithm available in ARTeMIS Modal Pro.
The results of an Ambient Vibration Test and Analysis of the Infante D. Henrique Bridge are presented below. The measurements have been made by Professors Alvaro Cunha and Filipe Magalhães, Faculdade de Engenharia da Universidade do Porto, Laboratory of Vibrations and Monitoring (http://paginas.fe.up.pt/vibest/), Porto, Portugal.
The Infante D. Henrique Bridge, over the Douro River, was open to traffic in 2004 to link the cities of Porto and Gaia, located at the north of Portugal. The bridge is composed of a rigid prestressed concrete box girder, 4.50m deep, supported by a shallow and thin reinforced concrete arch, 1.50 m thick. The arch spans 280 m between abutments and rises 25 m until the crown. In the 70 m central segment, arch and deck join to define a box girder 6m deep. The arch has constant thickness and its width increases linearly from 10m in the central span up to 20 m at the springs. Below some pictures of the bridge are shown.


The ambient vibration test was made without disturbing the normal use of the bridge, with accelerations induced by traffic and wind. To measure the very low amplitude accelerations, 4 tri-axial 18-bit strong motion recorders were used. During the ambient vibration test, two recorders served as references located permanently at the reference cross-section (see the blue arrows in the figure below) of the deck, in both sides of the deck (upstream and downstream), while the other two recorders scanned the bridge deck measuring the acceleration along the 3 orthogonal directions in both sides of the 15 cross-sections. All sensor positions in all 15 test setups can be seen in the figure below.
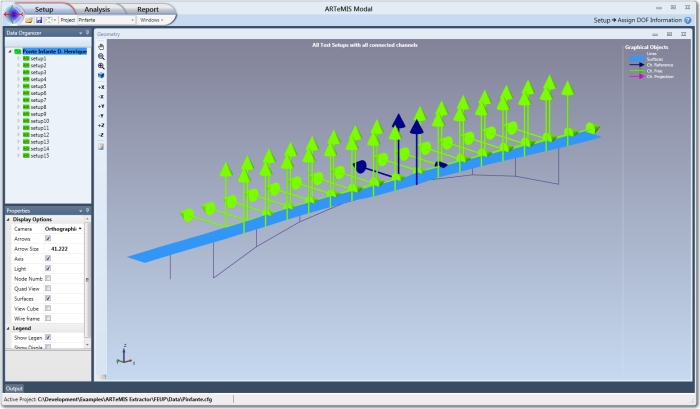
The Assign DOF Information Task displaying all sensors of the 15 Test Setups. The blue arrows are the reference sensors.
For each test setup, time series of 16 minutes were collected. The sampling frequency was 100 Hz, a value that is imposed by the filters of the acquisition equipment and that is much higher than the required for this bridge. Most of the relevant natural frequencies of the bridge are below 10 Hz. Therefore, a decimation of order 5 was applied before the operational modal analysis, reducing the sampling frequency from 100 Hz to 20 Hz.
The SSI-UPC Merged Test Setups Algorithm
The algorithm is developed in cooperation with our strategic partner – the French Institute National de Recherche en Informatique et en Automatique (Inria). This algorithm can be applied in the vast number of cases where several test setups have been measured using a set of fixed positioned reference sensors and a set of rowing sensors being moved across a structure from measurement to measurement. The algorithm can be described by the following steps:
The input to the algorithm is multiple time series measurements (Test Setups) that typically are uploaded through e.g. the SVS Configuration File.
Using the Prepare Data Task in ARTeMIS Modal Pro these measurements are then compressed into a set of so-called Common SSI matrices. These matrices are then merged together using a sophisticated scaling technique that utilizes the information of the references sensors of the Test Setups. This scaling technique is introduced to account for a potential change of vibration level from measurement to measurement.
The estimation of modes are then performed using a single Stabilization Diagram that displays the modal parameters of the range of state space models being estimated. The estimation of the state space models are made using the fast implementation of the Crystal Clear SSI estimator. The global modes are automatically estimated based on the stable modes of the diagram by a single click on the Auto button.
After uploading the 15 Test Setups the Common SSI matrices were estimated using a Max. Dimension of 300. This high dimension has been chosen because of the very low frequency modes of the data and the large number of modes in the data – The larger number and lower the modes are in frequency the higher dimension should be used.
Below the one and only Stabilization Diagram is shown. It displays the Singular Values Decomposition (SVD) of the Spectral Densities of all the Test Setups with an indication of all the global modes based on all Test Setups. The Crystal Clear SSI estimator was applied using a Max. No. of Eigenvalues setting of 66 that was automatically chosen by the algorithms.
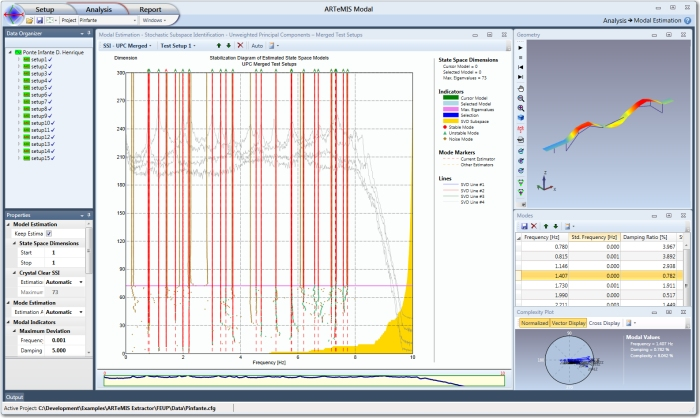
15 Test Setups of data from the Infante D. Henrique Bridge analyzed with SSI-UPC Merged Test Setups estimator in ARTeMIS Modal Pro.
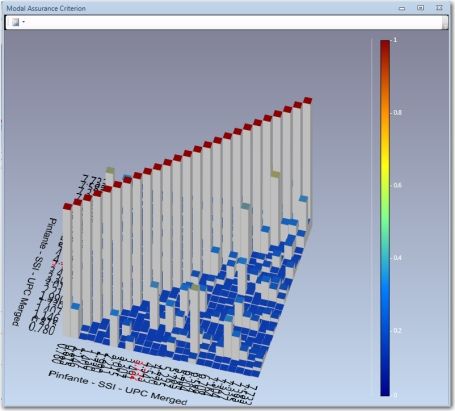
The result is 25 global modes shown in the table below to the left and the Modal Assurance Criterion (MAC) between the modes are shown to the right.
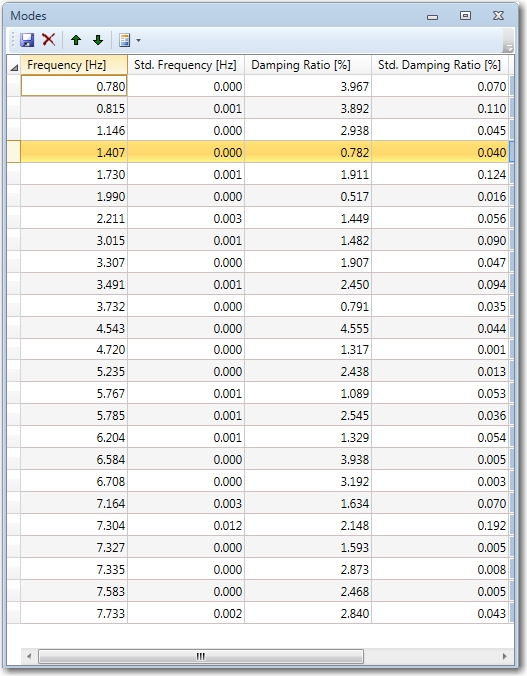
Estimated natural frequencies and damping ratios, and corresponding estimated standard deviations
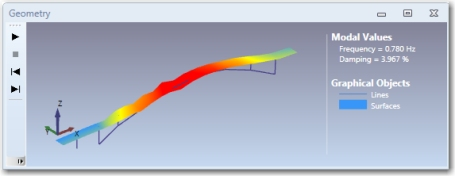
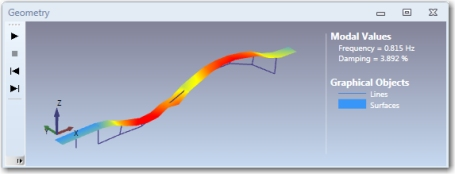
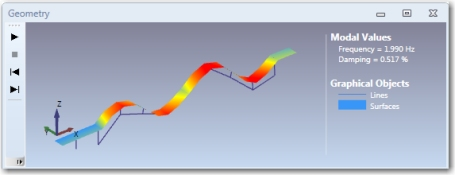
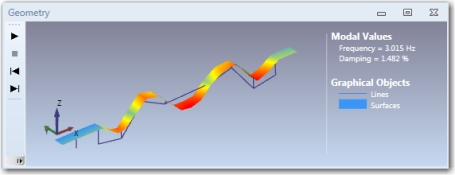
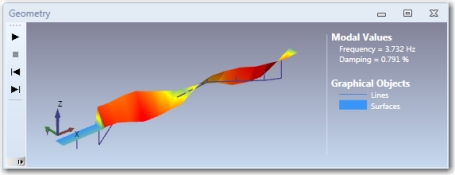
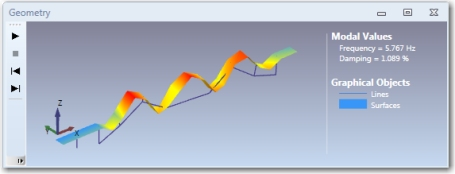
Below mode shapes of six of the estimated modes are shown.
M. Döhler, P. Andersen, L. Mevel:
Operational Modal Analysis using a Fast Stochastic Subspace Identification Method.
Proceedings of the 30th International Modal Analysis Conference (IMAC) Jacksonville, Florida USA, 2012.
M. Döhler, P. Andersen, L. Mevel:
Data Merging for Multi-Setup Operational Modal Analysis with Data-Driven SSI.
Proceedings of the 28th International Modal Analysis Conference (IMAC) Jacksonville, Florida USA, 2010.
F. Magalhães, A. Cunha, E. Caetano:
Dynamic monitoring of a long span arch bridge.
Engineering Structures, Vol. 30, pp. 3034-3044, 2008.
Palle Andersen
Managing Director, Ph.D.
Niels Jernes Vej 10
9220 Aalborg East, Denmark