Search
The Curve-fir Frequency Domain Decomposition (CFDD) adds a modal estimation layer to the FDD Modal Estimation just like the EFDD does. The modal estimation is therefore divided into two steps. The first step is to perform the FDD Peak Picking, and the second step is to use the FDD identified mode shapes to identify the Single-Degree-Of-Freedom (SDOF) Spectral Bell functions and from these SDOF Spectral Bells estimate both the frequency and damping ratio using a frequency domain curve fitting technique.
The identification of the SDOF Spectral Bell is performed using the FDD identified mode shape as reference vector in a correlation analysis based on the Modal Assurance Criterion (MAC). On both sides of the FDD picked frequency a MAC vector between the reference vector and the singular vectors corresponding to a certain frequency is calculated. If the largest MAC value of this vector is above a user-specified MAC Rejection Level the corresponding singular value is included in the description of the SDOF Spectral Bell. The search on both sides of the reference frequency is continued until no MAC values are above the rejection level. Outside the search range the values of the SDOF Spectral Bell is set to zero. This means that the lower MAC Rejection Level the more singular values are included in the SDOF Spectral Bell. However, at the same time the lower MAC Rejection Level the deviation from the reference vector is allowed. Therefore, a good compromise is to use an initial MAC Rejection Level at 0.8.
Besides storing the singular values that describe the SDOF Spectral Bell, the corresponding singular vectors are averaged together to obtain an improved estimate of the mode shape. The average is being weighted by multiplying the singular vectors with their corresponding singular values. This means that the closer the singular vectors is to the peak of the SDOF Spectral Bell the more weight it has on the mode shape estimate.
The natural frequency and the damping ratio of the mode is estimated by curve fitting the SDOF Spectral Bell using frequency domain least-squares estimation. Since the SDOF spectral bell is free of influence of other modes there is only a single eigenvalue and residue to fit. The natural frequency as well as the damping ratio are then extracted from the eigenvalue.
The CFDD Modal Estimation window looks as below when started right after the signal processing of the data is complete:
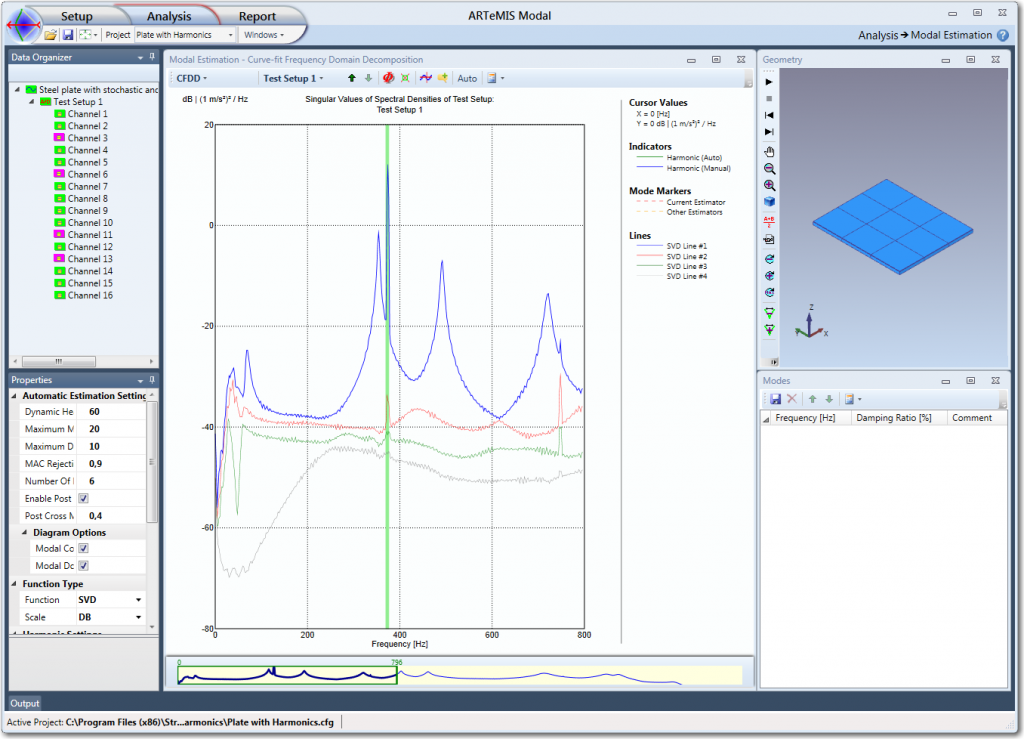
As it can be seen, it looks exactly like the FDD Modal Estimation window and the procedure is also exactly the same. The only difference between peak picking in FDD and CFDD is that in the last technique peak picking is used not only to obtain a reference frequency but also a mode shape to be used in the CFDD Modal Estimation.
When you estimate these reference parameters you will usually get the best result by picking on top of the peaks. Here the reference mode shape estimate will most accurate in case of well-separated modes. If the modes are repeated or closely spaced you should follow the guidelines listed in the description of the FDD Modal Estimation window, for estimation of these special cases.
When you have picked a reference mode shape and frequency, as seen below, the modal parameters estimation is performed immediately with the default settings. The default modal estimation setting called MAC Rejection Level is edited in the Properties window in the Estimation Parameters section, that is available when a specific Test Setup is selected, see below:
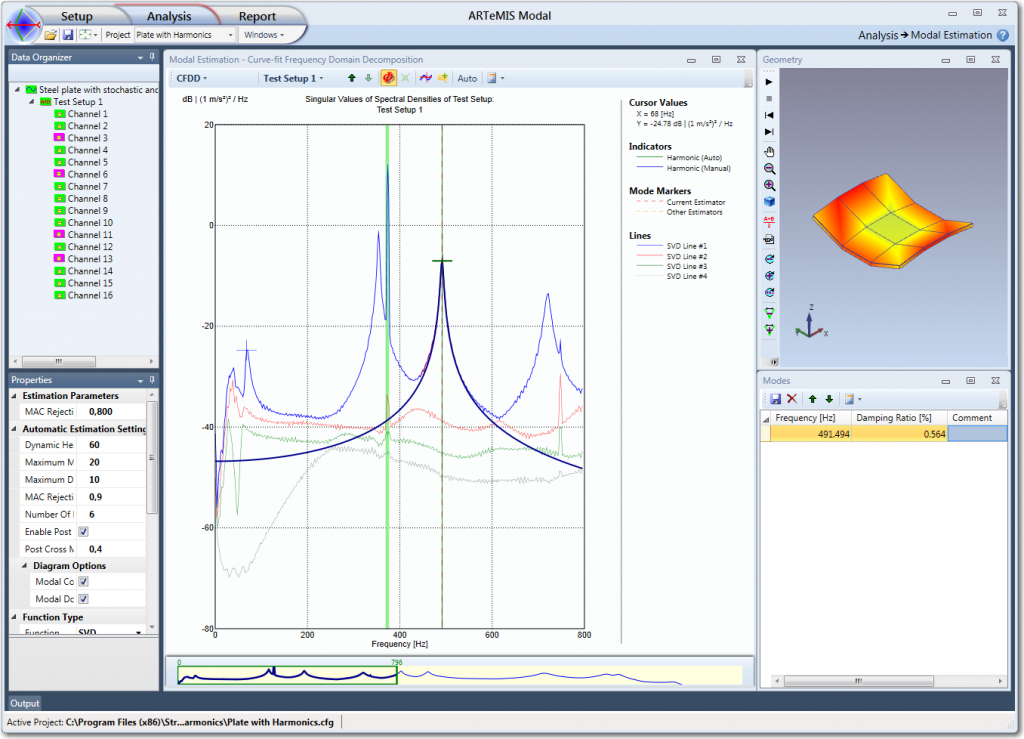
When you are located at a specific Test Setup as shown above the Modal Estimation window shows the SDOF Spectral Bell of the selected mode in red overlaid with the curve fit of the SDOF bell in blue.
You can now verify the identification of the SDOF Spectral Bell. In this case the SDOF Spectral Bell is identified using a default MAC Rejection Level of 0.8. What you need to verify is that you have a good representation of the SDOF Spectral Bell around the peak. In this case, the representation is good because the peak has been identified completely down to where the noise begin to affect it. If the curve fit doesn’t look like a SDOF bell it is most likely because there is not enough values for a try grab the left and right horizontal cursors shown in pink. Moving these towards the peak will force the estimator to focus on the peak values. The red singular values out side the interval spanned by the cursors are not included in the curve fit.