Search
All versions of ARTeMIS Modal support the Harmonic Detection and Removal (HDR) plugin that enables detection and possible removal of harmonic components present in the response measurements used for Operational Modal Analysis. In frequency domain, harmonic components can be seen as sharp peaks indicating the rotational frequencies and its possible multiples also called orders. The harmonic components can have a high level of energy compared to the modal response of the structure. This can seriously disturb the Operational Modal Analysis algorithms, that typically try to estimate what has most energy in a signal. The tools in this plugin are designed to help increase the performance of both time and frequency domain Operational Modal Analysis algorithms in ARTeMIS Modal.
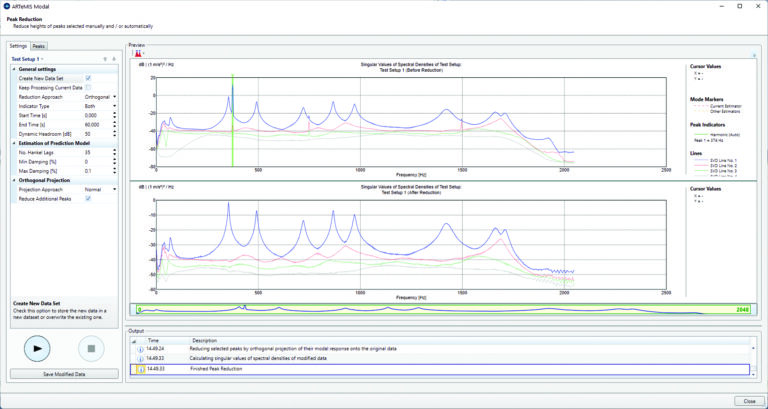
The measurements in the example shown consist of modal response mixed with sinusoidal excitation at 374 Hz. Besides the fundamental harmonic order also the second and fourth orders show up in the original data. The original data is displayed in the top Singular Values Decomposition (SVD) diagram derived from spectral density estimation. In this diagram, the green vertical harmonic indicator marks the frequency which is automatically detected to be a harmonic excitation.
The harmonic indicators determined by the harmonic detection are used as starting point for the harmonic reduction tool which then attempts to remove these harmonic components from the data. As an option, the reduction can also attempt to remove similar low damped components from the data. In this example, this option is enabled, and the two additional harmonic orders are removed.
After reduction, the harmonic components are completely removed as it can be seen in the bottom SVD diagram. The result of the harmonic reduction is saved and used as an input for the Operational Modal Analysis.
If measurements are taken on a wind turbine having three blades, then the rotational frequency (P1) will show up as a sharp peak. Also, the third order (P3) will show up due to the tower passage of three blades during a single revelation.

There are two detection algorithms in the HDR plugin that can identify the frequencies being dominated by sinusoidal response. The detection algorithms rely on the estimation of Kurtosis in a short frequency band of the measured response data. By sliding this frequency band through the entire frequency range, a frequency domain Kurtosis diagram appears.
Typically, modal response is Gaussian distributed resulting in Kurtosis values around the value 3. In the regions where harmonic components dominate, the Kurtosis will drop to the value 1.5. By setting a lower threshold (default 2.7), the software can then automatically detect which frequencies are potential harmonic components. This information can then be used by the Frequency Domain Decomposition algorithms for Operational Modal Analysis to avoid using information from the regions dominated by harmonic components.
By detecting the harmonic peaks, either using the automatic approach based on Kurtosis estimation, or by manually picking the harmonic peaks, the HDR plugin has a tool that can reduce and sometimes even remove the presence of harmonic components in the data. Two algorithms are available. One subtracts fitted sine waves from the measured data. The fitting is based on non-linear Gauss-Newton minimization. Another algorithm is based on an orthogonal projection approach. Here, a time series consisting only of the harmonic parts of the measured response data is estimated. Then the original measured response is projected orthogonal onto this harmonic time series. The result is a new time series of the response data in which the harmonic components are excluded.