Search
ARTeMIS Modal Pro has a series of plugin modules designed for Structural Health Monitoring purposes. All modules are designed to analyse and present the health of a monitored structure in various manners, and they all rely on the same common data manager base module. This module administrates the recorded measurement files as well as the results obtained during a periodic monitoring.
Each recorded measurement file is uploaded into an Analysis Session that is the container for the particular measurements and the results obtained from it. The Data Manager Base Module is responsible for the administration of the Analysis Sessions. It stores and retrieves the different Analysis Sessions when requested by the analysis modules. The Data Manager extends the ARTeMIS Modal Pro platform that basically only handles a single Analysis Session. The features are summarized below:
Support for Multiple Analysis Sessions.
External storage with saving and loading of measurements and results for each Analysis Session.
Historical measurement statistics (Maximum, Minimum, RMS, Median, Mean, Variance, Skewness, Kurtosis).
3D display of all measurements in frequency domain using the Singular Value Decomposition.
Master Session definition, allowing automatic processing across all Analysis Sessions using settings of the Master Session. Includes automatic SSI modal estimation.
Notification (Alert) services. Visual, sound, email, web service.
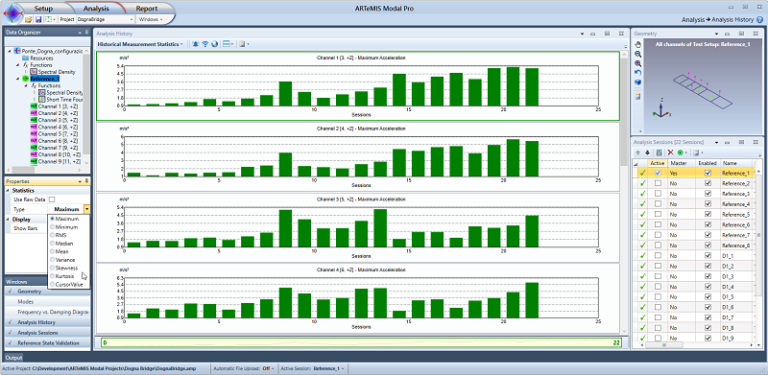
Historical Measurement Statistics. With this tool consistency of measuremeents can be checked either on channel level or Test Setup level
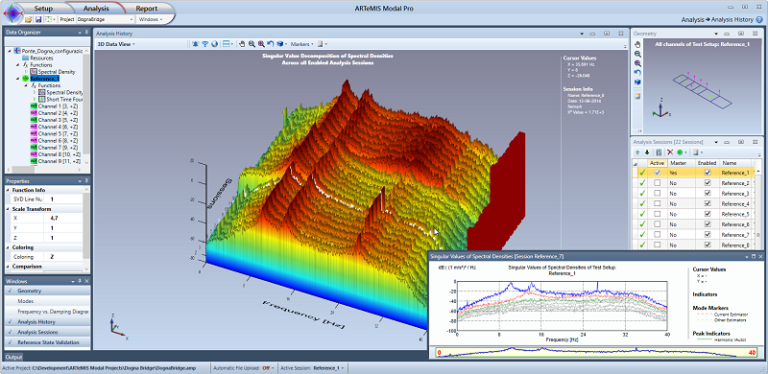
3D Data View. Use this tool to visualize potential historical changes of a structures dynamic behavior. See e.g. this YouTube video.
The Damage Detection module consists of two different damage detection algorithms that have been developed for long-term monitoring of structures. The algorithms are robust to the natural change of a structure’s dynamic behavior due to the changes of ambient conditions and can be set up to not reacting on such changes. The plugin also includes a Control Chart that, as input, can take a user-definable set of damage indicators and unify them to a single control value with corresponding statistical based threshold. This control chart can automatically notify (alert) when the threshold is being passed after an analysis. The notification can be sounds, emails or web service calls to third party systems.
The features are summarized below:
Classic and Robust Damage Detection.
Automatic damage indicator updates when new measurements are uploaded.
Reference State Validation for visual validation of the null space estimation of the reference state model.
Hotelling Control Chart unifying damage indicators into a single indicator with a single statistical based threshold.
In the figure below, the damage detection is demonstrated using data from a bridge in Italy, that was measured for a period before damaging it. There are eight reference measurements that are presented by the first eight green vertical bars in the diagram.
The level of these bars shows the level of the damage indicators under normal conditions. From the first six measurements, a baseline (reference) model is determined by the module, and a threshold is automatically estimated based on the statistical evaluation of the damage indices of the six reference measurements.
As seen, the last two reference measurements stay under the threshold which indicates that the bridge is still undamaged. The remaining 14 measurements are all acquired after the bridge experienced damage, and the associated damage indicators all pass the threshold significantly and indicate a permanent damage.
Damage Detection of an Italian bridge. 8 reference (undamaged) measurements indicated with the green vertical bars staying below the thresholds. 14 measurements of the damaged bridge that all pass the thresholds significantly. The figure also show the Reference State Validation diagram used to validate the reference state model.
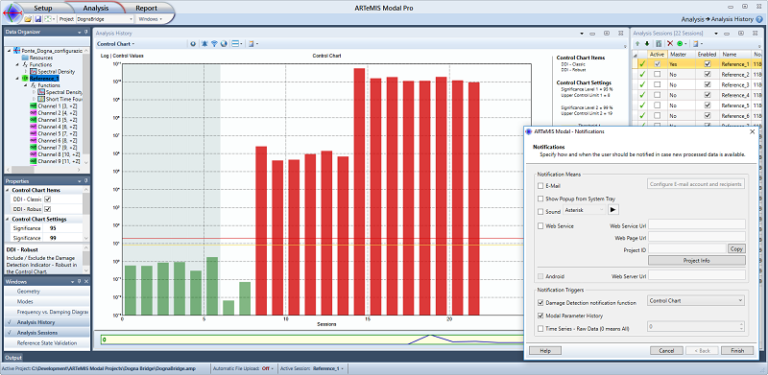
Hotelling Control Chart showing a series of a unified damage indicator calculated from two independent damage detection methods. The figure also show the Notifications setup dialog.
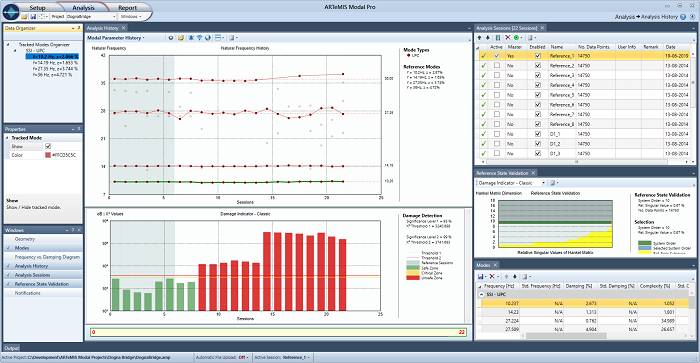
Similar to the Damage Detection Module, the modes of the structure can be presented in a historical view. The Modal Parameter History Module has been designed for this. It presents the modal parameters as a function of the Analysis Sessions. In addition, it can automatically track modes determined in a reference state. Even though they change slightly in subsequent Analysis Sessions, the Mode Tracking is capable of keeping track of them. The tracked modes are presented as modal indicators that are inter-connected.Pointing at the line with the mouse allows further information of the particular tracked mode.
The features are summarized below:
Historical presentation of natural frequencies and damping ratios.
Historical export of modal parameters to SVS and UFF file formats.
Automatic mode tracking based on the estimation of a set of reference modes obtained from a specified set of reference Analysis Sessions.
Historical presentation of the tracked modes (Drawn interconnected). Natural frequencies and damping ratios – absolute and relative to their reference mode. Modal Assurance Criterion of the mode shapes relative to the mode shape of their reference mode.
Historical export of tracked modes to SVS and UFF file formats.
In the figure below, the natural frequency of three tracked modes is presented. The two first modes are reasonable unaffected by the damage whereas the third mode is heavily influenced and even disappears for a while when damage occurs.
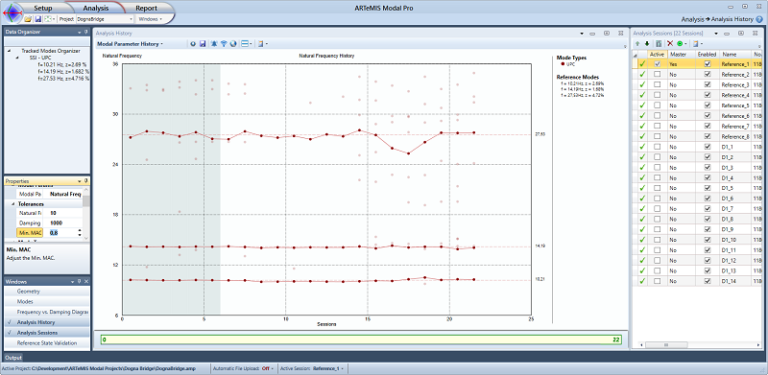
Modal Parameter History with automatic Mode Tracking of three modes. The natural frequency of the first two modes is quite unaffected by the damage. Once damage is occurring the third mode changes.
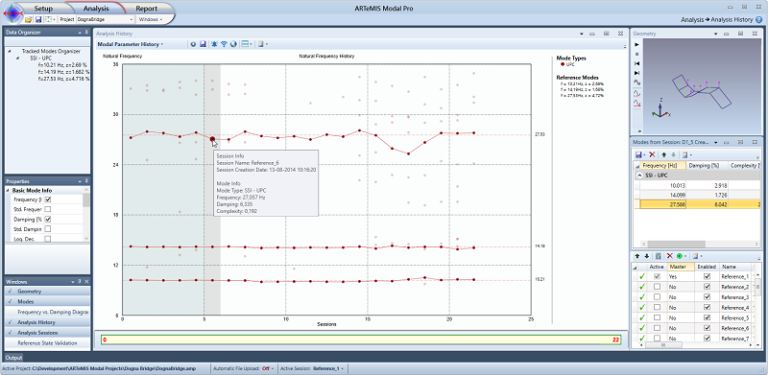
Clicking on a specific indicator in the diagram will present the corresponding mode in the Modes List of the Analysis Sessions and start an animation of its mode shape.
As shown in the figure below, the Mode Tracking can also be presented in terms of other modal parameters such as the damping ratios and mode shapes. In case of the mode shapes, it will be the Modal Assurance Criterion between the reference state mode shape and the mode shape of the different Analysis Sessions.
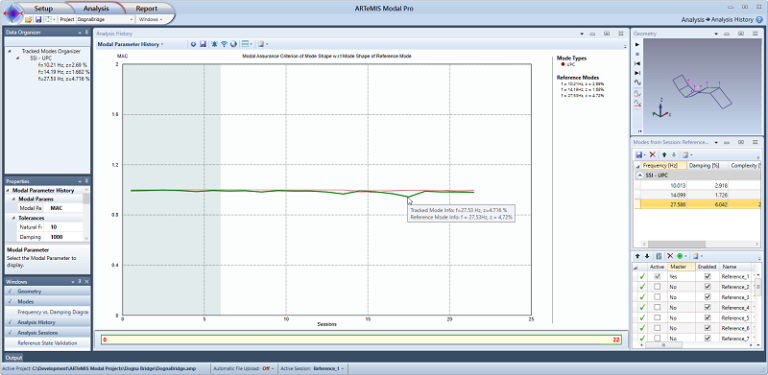
Mode Tracking of three modes presented in terms of the change of the Modal Assurance Criterion of the modes between the reference state and the current state. The highligted mode is the third mode that also has a significant change of the MAC value as damage occurs.
The Automatic File Upload module is designed to automatically upload and process measurement files arriving in designated file folder on the user network. It is possible to configure the file location and file type as well as the type of processing that should be initiated after file upload. The module allows ARTeMIS Modal Pro to fully plug into any third party physical data acquisition system and to perform automatic data analysis using any of the above-mentioned analysis modules as well as the native Operational Modal Analysis techniques of ARTeMIS Modal Pro.
The features are summarized below:
Automatic file upload from a specific folder on a specific interval.
Support all ARTeMIS Modal input file formats.
Automatic processing of uploaded measurements.
Automatic file post processing (Move, Delete, Rename).
The Drift Analysis Module is designed to analyze interstorey drift based on measurements from sensors located at the top and bottom of structural elements. These elements can e.g. be columns. If the drift exceeds a certain percentage of the distance between the sensor locations, the module will automatically alert the user.
Drift analysis is typically made on many critical elements on a structure. For each observed element, a drift definition is made. This definition includes the sensors, the critical relative drift ratio and what weight an alarm from this element should have for a user alert. Drift analysis can be made on a single or multiple analysis sessions projects. The analysis is set up in the Drift Analysis Task, where the analysis results of the currently active analysis session can be inspected. By selecting a drift definition, the records from the two corresponding channels can be viewed.
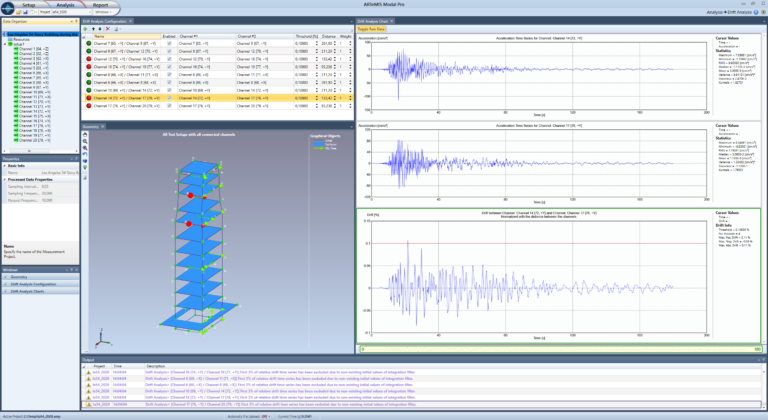
Drift analysis of a 54 storey building in Los Angeles during the 1994 Northridge Earthquake. The critical relative drift ratio has been set to 0.1%, which has triggered four out of the nine drift definitions. The selected definition has triggered one time shortly after the most intense shaking.
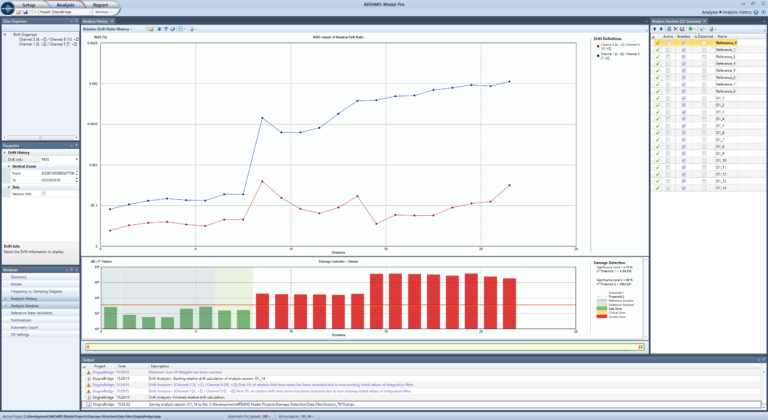
Drift analysis is a powerful tool for the study of growing damage in structural elements. Here the relative drift of two structural elements is observed. It has been calculated using 22 measurements on a structure exhibiting an increasing damage. The two curves in the top diagram depicts the development of the relative drift of each of the two structural elements. The damage affects the structural element corresponding to the blue curve most. In the diagram at the bottom, a damage indicator of the overall structural integrity is also shown for the same 22 measurements (available using the damage detection module). It is clear to see that damage starts at the ninth measurement, where damage indicators turn red, and the relative drift ratios start increasing significantly
The records are either the original accelerations or the processed displacements. In addition, the relative drift time series is displayed. This time series is obtained by subtracting the two displacement time series and dividing with the physical distance between the sensors. Alerts are issued if the absolute value of this relative drift time series exceeds the critical relative drift ratio. Additional information is available: number of times the critical relative drift ratio has been exceeded, the absolute largest as well as the minimum and maximum relative drift values found. When selecting a drift definition, the corresponding sensors are graphically highlighted in the geometry, to allow easy identification of the location of the structural element.
The interstorey drift analysis module seamlessly integrates into the Analysis History Task along with all the other methods for Structural Health Monitoring in case of continuous monitoring of structural integrity.
If a structure is monitored by ARTeMIS Modal Pro and if drift definitions has been defined in the Drift Analysis Task, then the development of the relative drift values over time can be viewed in the Analysis History Task. In the diagram curves of each of the drift definitions are presented. The values that are presented are measures of the processed drift time histories. These values are absolute largest, RMS value, minimum and maximum values. Also, number of exceedances per analysis session can be visualized. In case the uploaded time histories from the sensors are continuous in time, then ARTeMIS Modal can be instructed to use the final integration filter coefficients of an analysis session as the initial filter coefficients in the proceeding analysis session.